


The Cambria Foreign Shareholder Yield ETF (BATS:FYLD) is an appealing ETF investing in developed international markets, yielding 6%. I’m bullish on this $250 million fund from Cambria because of its attractive dividend yield, diversified portfolio, and inexpensive holdings.
Elevate Your Investing Strategy:
- Take advantage of TipRanks Premium at 50% off! Unlock powerful investing tools, advanced data, and expert analyst insights to help you invest with confidence.
What Is the FYLD ETF’s Strategy?
We recently wrote about the Cambria Shareholder Yield ETF (BATS:SYLD), which has posted an impressive performance in recent years and focuses on shareholder yield. FYLD is similarly focused on shareholder yield but invests in international, developed market equities instead of in U.S. equities like SYLD.
According to Cambria, FYLD “focuses on high-cash distribution companies internationally that are returning their cash to investors through three attributes – dividends, buybacks, and debt paydown – collectively known as shareholder yield.”
Shareholder yield is calculated by adding these three attributes (dividends, net share repurchases, and net debt reduction) and dividing them by a company’s market capitalization.
Investing in international stocks with high shareholder yields creates a portfolio with a valuation that is significantly lower than that of FYLD’s benchmark, the MSCI EAFE Index, which “represent(s) the performance of large and mid-cap securities across 21 developed markets, including countries in Europe, Australasia and the Far East, excluding the U.S. and Canada.”
As of the end of the most recent quarter, the price-to-earnings ratio for FYLD’s portfolio was just a paltry 7.6, versus a considerably higher price-to-earnings ratio of 13.8 for the MSCI EAFE Index as a whole. Investors should note that both of these valuations are cheaper than U.S. stocks. For instance, the S&P 500 (SPX) currently has a price-to-earnings multiple of 22.4.
FYLD’s holdings also trade at a slight discount to book value, whereas the MSCI EAFE Index trades for an average price-to-book ratio of 1.7.
Additionally, Cambria says another advantage of the fund is that focusing on stocks with favorable shareholder yields, as opposed to simply investing in stocks with high dividend yields, “may provide more attractive growth characteristics” and healthier balance sheets.
Investment Process
To arrive at this portfolio of international stocks with inexpensive valuations and high shareholder yields, FYLD uses a fairly exhaustive investment process.
The fund’s portfolio management team begins by looking through a universe of all foreign-developed market stocks with market caps of over $200 million. They then select the top 20% of these stocks with the highest shareholder yields and also evaluate these stocks based on traditional valuation metrics like price-to-earnings, price-to-book, and price-to-sales. They exclude certain stocks based on quality or leverage concerns.
Next, the portfolio management team selects the top 100 stocks from this list with the most attractive combination of shareholder yield and valuation.
This screening process begins again each quarter, and the fund is rebalanced on a quarterly basis.
FYLD’s Holdings
What type of portfolio does this investment process create for FYLD? The well-diversified fund owns 101 stocks, and its top 10 holdings comprise just a minuscule 15.0% of assets.
Below, you’ll find an overview of FYLD’s top 10 holdings created using TipRanks’ holdings tool.
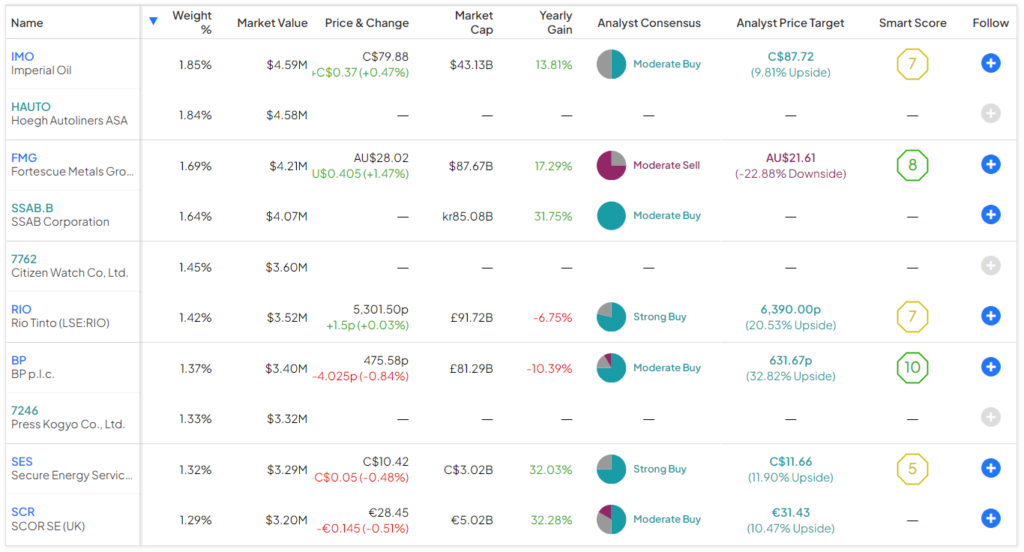
The fund invests in all types of international stocks, with a noticeable bias toward sectors that typically feature cheaper valuations, including energy, basic materials, and financials.
U.S. investors will likely be familiar with some of the fund’s energy positions, such as its top holding, Canada’s Imperial Oil (NYSE:IMO), plus energy supermajors like the UK’s BP (NYSE:BP) and France’s TotalEnergies (NYSE:TTE), although TTE is not a top 10 holding. Miners are also well-represented through the likes of the Rio Tinto (NYSE:RIO) and Glencore (OTC:GLCNF).
As of the end of the most recent quarter, FYLD’s largest exposure was to financials, with a weighting of 23.9%, followed by energy (20.9%), industrials (18.0%), and materials (16.9%).
FYLD is also diversified across geographies, with Japan accounting for the fund’s largest exposure with a weighting of 22.7%. Some other markets it’s invested in include Canada (14.0%), the U.K. (11.2%), France (9.0%), Australia (7.2%), and Hong Kong (7.0%).
Significant Dividend Yield
FYLD stands out for its 6% dividend yield. This yield is more than four times higher than that of the S&P 500, which currently yields just 1.4%. It is also higher than that of popular international dividend ETFs like the Vanguard International High Dividend Yield ETF (NASDAQ:VYMI) and the Schwab International Dividend Equity ETF (NYSEARCA:SCHY), which yield 4.6% and 4.0%, respectively.
A Mixed Performance Over the Years
FYLD’s performance has been a mixed bag. On the negative side, it has underperformed the S&P 500 in recent years. On the positive side, it has outperformed its international developed markets benchmark over the past three and five years. As of the end of the most recent quarter, FYLD’s annualized three-year return of 8.2% easily trumped the MSCI EAFE’s annualized return of 4.5% over the same time frame. Over a five-year time horizon, FYLD’s annualized return of 9.3% bested the benchmark’s return of 8.7%.
This underperformance versus simply investing in the S&P 500 markets stings for investors, but on the other hand, it isn’t a bad idea for U.S. investors to diversify by gaining exposure to international stocks, and FYLD has proven to be a good way to do this with its benchmark-topping performance. Furthermore, past performance is no guarantee of future results, so if international stocks begin to catch up with the performance of their U.S. peers at some point in the future, FYLD would be a good place to be invested.
What’s FYLD’s Expense Ratio?
FYLD’s expense ratio of 0.59% is on the higher end, but it’s not out of line for an actively-managed ETF or an ETF investing internationally, which are typically more expensive than run-of-the-mill index ETFs that invest domestically.
This expense ratio means an investor will pay $59 in fees annually on a $10,000 investment in the fund. Assuming that the fund returns 5% per year going forward and maintains its 0.59% expense ratio, this investor would pay $329 in fees on their initial $10,000 investment over five years.
The Takeaway: A Strong International ETF Option
The main downside of FYLD is that its performance hasn’t set the world on fire. However, the underperformance against the S&P 500 is outside of FYLD’s control, as it invests internationally, and international markets have struggled to beat the U.S. market over the years. Still, the fund has beaten its benchmark of international, developed markets stocks over the past three and five years, so it looks like one of the better ways to diversify by investing in developed international markets.
All things considered, I’m bullish on this ETF as a way to gain international exposure based on its diversified portfolio of cheap stocks with high shareholder yields across a wide range of geographies and industries and its attractive 6% dividend yield.