


When investors think of tech ETFs, they often think of the massively popular Invesco QQQ Trust (NASDAQ:QQQ) and the Technology Select Sector SPDR ETF (NYSEARCA:XLK) — rightfully so, as these are low-cost long-term winners that have performed well for years. But there’s also an overlooked tech ETF that deserves to be in this conversation as well and is worthy of more attention — the Fidelity MSCI Information Technology ETF (NYSEARCA:FTEC).
Elevate Your Investing Strategy:
- Take advantage of TipRanks Premium at 50% off! Unlock powerful investing tools, advanced data, and expert analyst insights to help you invest with confidence.
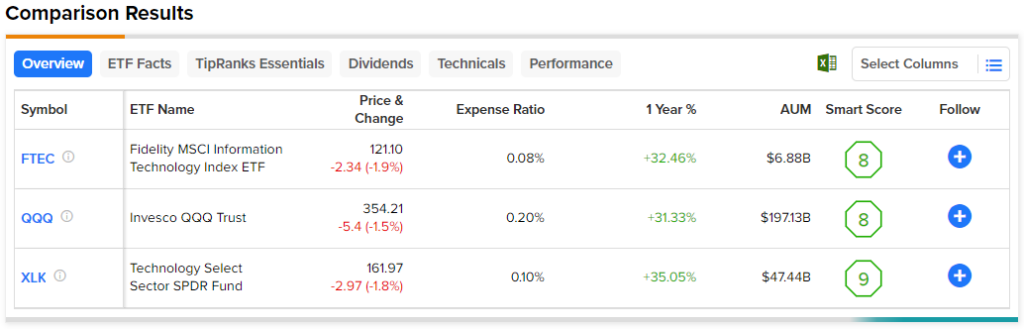
At $6.9 billion in assets under management (AUM), FTEC isn’t as big as QQQ or XLK, but its long-term performance is comparable to that of these two juggernauts, and it’s actually an even more cost-effective option for investors. Here’s more on FTEC.
What is the FTEC ETF’s Strategy?
The passively-managed FTEC ETF invests at least 80% of its assets in its underlying index, the MSCI USA IMI Information Technology 25/50 Index. All of the stocks in this index are classified within the technology sector by the Global Industry Classification Standard (GICS).
FTEC’s Strong Past Performance
FTEC has put up some great returns over the years. In the past year, the fund has returned 28.4%. Over the past three years, as of the end of August, FTEC returned 11.5% on an annualized basis. FTEC has returned an even better 17.9% on an annualized basis over the past five years. FTEC launched in October 2013, so it does not yet have a 10-year annualized return as it approaches its 10-year anniversary, but it has returned an impressive 19.6% on an annualized basis over the life of the fund.
These results slightly underperformed those of XLK but are within the same ballpark. XLK has returned 31.1% over the past year. Over the past three and five-year time frames, XLK has posted total annualized returns of 13.4% and 19.6%, slightly outperforming FTEC.
Meanwhile, QQQ has returned 27.2% over the past year. Further, QQQ has posted annualized returns of 9.3% and 16.0% over the past three and five years, respectively, slightly underperforming FTEC.
As you can see, while FTEC slightly trailed behind XLK over the past three and five years, it outperformed QQQ, meaning that it deserves to be in the conversation with these top tech ETFs.
Low Fees
FTEC is in the same league as these top tech ETFs based on its multi-year performance. And it also is right in the mix with them based on its low expense ratio. In fact, with an expense ratio of 0.08%, it’s even cheaper than both QQQ and XLK, even though both are well-known for being cost-effective. QQQ has an expense ratio of 0.20%, while XLK sports an expense ratio of 0.10%.
An investor in FTEC would pay just $8 in fees on a $10,000 investment over the course of one year. Someone putting the same amount into XLK would pay $10 in fees, and an investor allocating the same amount into QQQ would pay $20. These are all reasonable amounts, but FTEC is the cheapest of the three funds.
You can see how these minor differences in expenses compound over time by looking further out. Assuming that each fund returns 5% per year going forward and that each maintains its current expense ratio, the FTEC investor would pay just $108 in fees over the course of 10 years versus $128 for the XLK investor and $255 for the QQQ investor.
Below, you can check out a comparison of FTEC versus QQQ and XLK using TipRanks’ ETF comparison tool. This unique tool enables investors to compare ETFs on a variety of factors, including their expense ratios, long-term performances, and Smart Scores. Investors can use the ETF comparison tool to simultaneously compare up to 20 ETFs at a time.
FTEC’s Holdings
FTEC offers good diversification since it owns 314 stocks, but it is also fairly concentrated in that its top 10 holdings account for a relatively high 61.4% of assets. For comparison, XLK owns 67 stocks, and its top 10 holdings make up 69.9% of the fund, while QQQ owns 102 stocks, and its top 10 holdings account for 48.3% of the fund.
Below, you can check out FTEC’s top 10 holdings using TipRanks’ holdings tool.
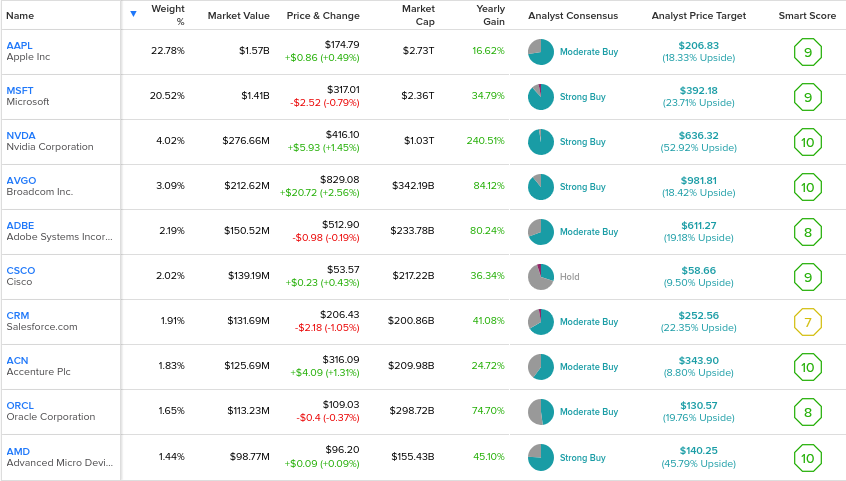
FTEC features many of the top tech stocks that are household names in today’s stock market. Apple (NASDAQ:AAPL) and Microsoft (NASDAQ:MSFT), the two largest companies in the world by market capitalization, enjoy particularly large weightings of 22.8% and 20.5% within the fund.
Meanwhile, the semiconductor industry is well-represented in FTEC’s top 10 holdings through the likes of Nvidia (NASDAQ:NVDA), Broadcom (NASDAQ:AVGO), and Advanced Micro Devices (NASDAQ:AMD). Enterprise software mega-caps like Adobe (NASDAQ:ADBE), Salesforce (NYSE:CRM), and Oracle (NYSE:ORCL) also occupy top 10 positions within the fund.
Further, an impressive nine out of FTEC’s top 10 holdings feature Smart Scores of 8 or above. The Smart Score is a proprietary quantitative stock scoring system created by TipRanks. It gives stocks a score from 1 to 10 based on eight market key factors. A score of 8 or above is equivalent to an Outperform rating. FTEC itself features an Outperform-equivalent ETF Smart Score of 8 out of 10.
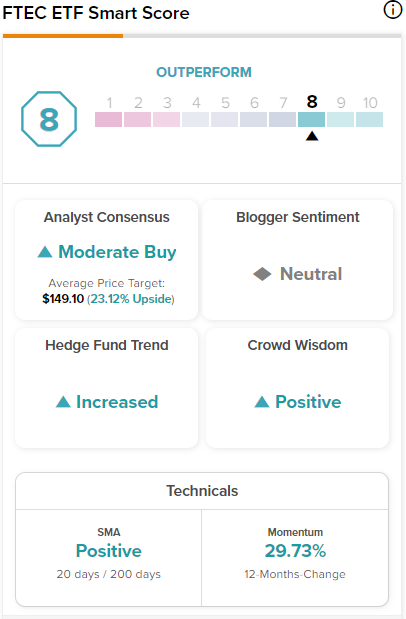
Not only is the Smart Score optimistic about FTEC and its individual holdings, but so are Wall Street analysts, as you’ll see below.
Is FTEC Stock a Buy, According to Analysts?
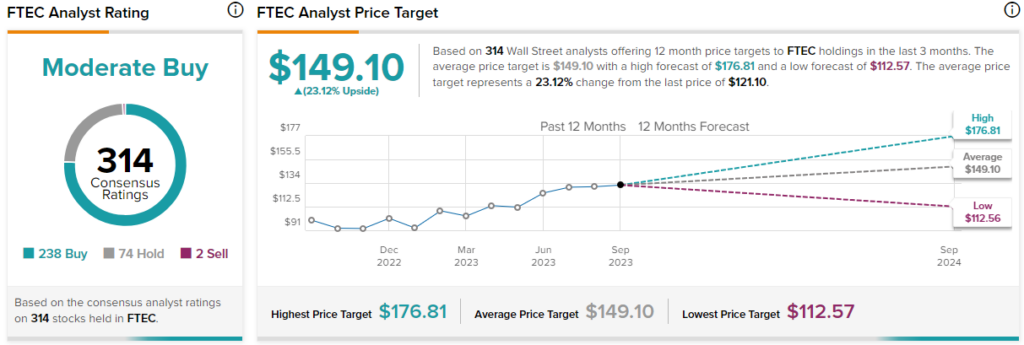
Turning to Wall Street, FTEC earns a Moderate Buy consensus rating based on 238 Buys, 74 Holds, and two Sell ratings assigned in the past three months. The average FTEC stock price target of $149.10 implies 23.1% upside potential.
Investor Takeaway
While it doesn’t get as much attention as its counterparts XLK or QQQ, FTEC is right up there with them as another top tech ETF. Its performance over the past five years is comparable to those of the two larger funds, and it is actually slightly more cost-effective to own.
All three of these ETFs are great funds, but FTEC, in particular, warrants further investor consideration based on its strong long-term track record, its high-quality portfolio of top tech stocks, and its minimal expense ratio.