


While it doesn’t get the same level of attention as some of its bigger and better-known competitors, the Fidelity MSCI Energy Index ETF (NYSEARCA:FENY) is another excellent, low-cost way for investors to gain exposure to top energy stocks, which have been performing well. Therefore, let’s take a look at what makes the FENY ETF attractive.
Elevate Your Investing Strategy:
- Take advantage of TipRanks Premium at 50% off! Unlock powerful investing tools, advanced data, and expert analyst insights to help you invest with confidence.
What is FENY ETFs Strategy?
FENY is an ETF from asset management giant Fidelity that invests in the MSCI USA IMI Energy Index, which “represents the performance of the energy sector in the U.S. equity market,” according to Fidelity. The fund has been around since 2013.
However, while it has grown in prominence, with $1.6 billion in assets under management, it is still much smaller than comparable energy ETFs like the Energy Select Sector SPDR ETF (NYSEARCA:XLE) and the Vanguard Energy ETF (NYSEARCA:VDE), which have $37.4 billion and $8.4 billion in assets under management, respectively.
Minimal Expense Ratio
Popular energy ETFs like XLE and VDE are low-cost options, as both sport expense ratios of just 0.10%. While these are attractive expense ratios, FENY is even cheaper than these two larger competitors, albeit by a slim margin, with a rock-bottom expense ratio of just 0.084%.
While FENY is marginally cheaper than these other reasonably-priced ETFs, it’s much cheaper than many other names in the energy ETF space — for example, the VanEck Oil Services ETF (NYSEARCA:OIH) and the SPDR S&P Oil & Gas Exploration ETFs (NYSEARCA:XOP) each have expense ratios of 0.35%.
An individual making a $10,000 investment in FENY would pay just $9 in fees in year one. Assuming the expense ratio stays at 0.084% and that the fund returns 5% per year, this investor would pay just $108 in fees over the course of a decade. This edges out the $128 that an investor in XLE or VDE would pay over the same time frame, and is significantly better than the $443 in fees that an investor in OIH or XOP would pay.
A Respectable Dividend
FENY sports an attractive dividend yield of 3.4%. It has paid investors a dividend for the last nine years, and it has increased its dividend payment for the last two years.
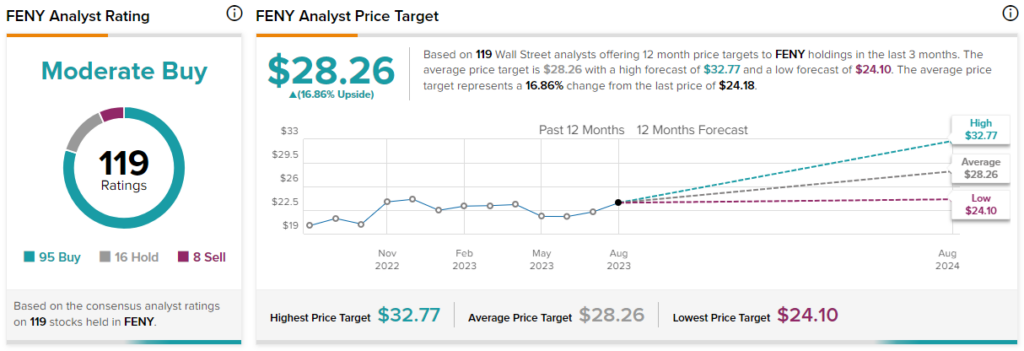
Is FENY Stock a Buy, According to Analysts?
Turning to Wall Street, FENY has a Moderate Buy consensus rating, with 95 Buys, 16 Holds, and eight Sell ratings assigned in the past three months. At $28.26, the average FENY stock price target implies 16.9% upside potential.
FENY’s Holdings
What does FENY’s portfolio look like? The fund is diversified in that it holds 118 different stocks, but it is a bit less diversified than this number would imply, as its top 10 holdings account for 65.2% of assets. Still, this offers better diversification than XLE, which holds 23 stocks (and where its top 10 holdings make up 73.4% of the fund), and very similar diversification to VDE, which holds 113 stocks (and where its top 10 holdings make up 64.9% of the fund).
Because of their massive market caps, U.S. energy supermajors ExxonMobil (NYSE:XOM) and Chevron (NYSE:CVX) account for large weightings in each of these funds, which is a big part of the reason that their top 10 holdings account for such significant portions of their holdings. Below, you’ll find an overview of FENY’s top 10 holdings using TipRanks’ holdings tool.
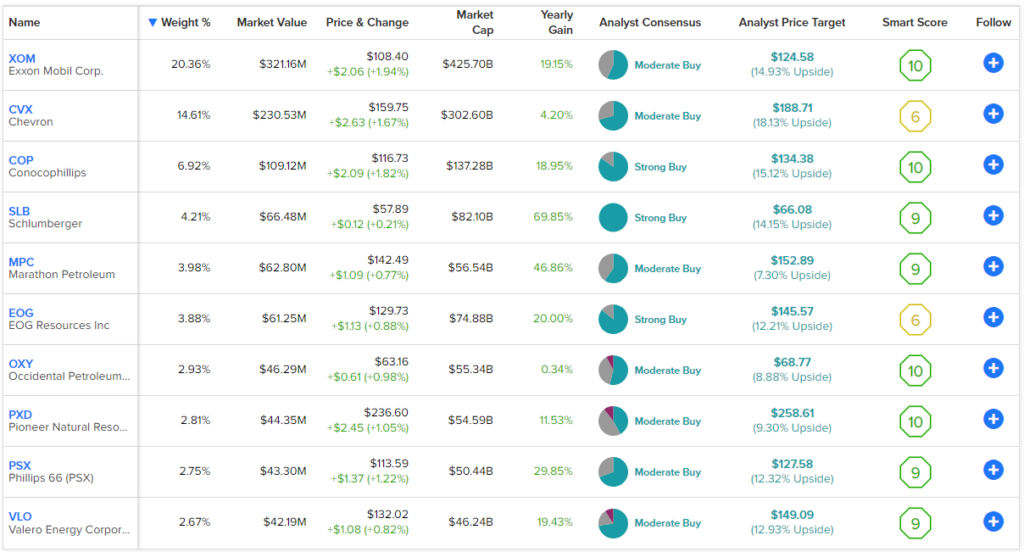
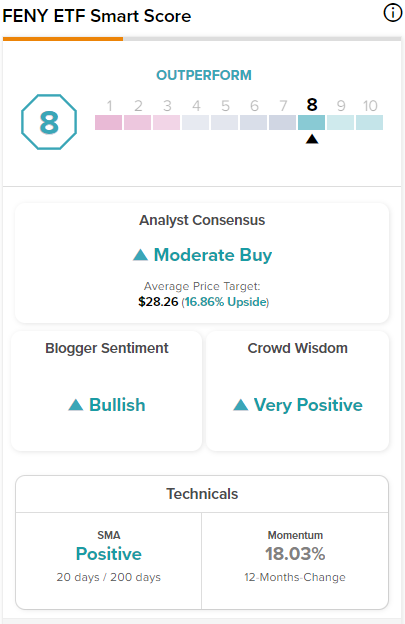
Looking at its holdings, you’ll immediately notice that FENY’s top 10 holdings collectively feature a fantastic group of Smart Scores. The Smart Score is a proprietary quantitative stock scoring system created by TipRanks. It gives stocks a score from 1 to 10 based on eight market key factors. A score of 8 or above is equivalent to an Outperform rating. The score is data-driven and does not involve any human intervention.
An incredible eight out of FENY’s top 10 holdings feature Outperform-equivalent Smart Scores of 8 or above. Notably, Exxon Mobil, ConocoPhillips (NYSE:COP), Occidental Petroleum (NYSE:OXY), and Pioneer Natural Resources (NYSE:PXD) all feature enviable ‘Perfect 10’ Smart Scores.
FENY itself boasts an outperform-equivalent ETF Smart Score of 8.
Another nice thing about FENY is that it gives investors exposure to all aspects of the energy industry, whether its integrated, multinational supermajors like ExxonMobil and Chevron, exploration and production companies, downstream companies and refiners, or midstream companies and pipelines. There are also companies that provide the services and technologies that enable these companies to operate their oil fields, like Schlumberger, Haliburton (NYSE:HAL), and Baker Hughes (NASDAQ:BKR).
Past Performance
As of the end of July, FENY had an incredible three-year total annualized return of 42.0%. This lofty return trounces that of the broader market — the Vanguard S&P 500 ETF (NYSEARCA:VOO) returned 13.7% on an annualized basis over the past three years. It even beats the performance of high-flying tech sector ETFs like the Technology Select Sector SPDR Fund (NYSEARCA:XLK), which returned 18.3% over the same time frame.
However, over the past five years, its total annualized return is just 7.0%, indicating that this is an ETF that has its shares of highs and lows, as opposed to a slow and steady compound grower. The ETF posted a total return of 55.7% in 2021 and followed it up with a 63.1% total return in 2022, but this was preceded by an ugly 2020 in which it lost 33.2%. This means that this is probably the type of ETF that you want to try to take profits on periodically as opposed to one that you want to buy and hold forever.
These three- and five-year performances are more or less in line with those of XLE and VDE. XLE posted a 40.7% annualized return over the same three-year time frame and a 7.8% annualized total return over five years. Similarly, Vanguard’s VDE returned 42.2% annualized over three years and 7.8% over five years.
Below, you’ll find a table comparing these three like-minded energy ETFs created using TipRanks’ ETF Comparison Tool, which enables investors to compare up to 20 ETFs at a time across a broad spectrum of factors.

Conclusion
With a favorable expense ratio, an attractive dividend yield, a positive view from analysts, and an impressive group of holdings featuring some very strong Smart Scores, FENY looks like a strong choice for ETF investors who want to gain exposure to the energy sector.
It has had its share of ups and downs over the years, indicating that this may be more of an ETF to hold for a period of time and take profits on rather than one where you can “set it and forget it” and hold it for the next 30 years, but recent performance shows that it can be a profitable ETF to own when the energy sector is performing well.