


You often hear investors talk about looking for high-quality companies to invest in, but what does “high quality” mean in reality? There are different ways of defining quality, but BlackRock’s (NYSE:BLK) iShares MSCI USA Quality Factor ETF (BATS:QUAL) has its own criteria, and it uses this as the basis for its investments. How does it work, and has seeking quality paid off over time for investors?
Elevate Your Investing Strategy:
- Take advantage of TipRanks Premium at 55% off! Unlock powerful investing tools, advanced data, and expert analyst insights to help you invest with confidence.
What Does the QUAL ETF Do?
QUAL is a large $31 billion ETF from BlackRock’s iShares that invests in mid and large-cap U.S. stocks that “exhibit positive fundamentals, including high return on equity, stable year-over-year earnings growth, and low financial leverage.” Its underlying index is the MSCI USA Sector Neutral Quality Index
iShares says that QUAL screens for return on equity to find profitable companies, low earnings variability so that it is investing in stocks with stable earnings, and low debt-to-equity ratios to ensure that it is investing in stocks with low leverage. These all seem like sensible screens and good ways to weed out many of the market’s lower-quality stocks.
QUAL’s Holdings
QUAL’s purpose is to find and invest in companies with high-quality characteristics, so it’s no surprise that its portfolio is comprised largely of companies most investors typically think of as blue-chip stocks. The fund is very diversified and holds 126 different positions.
Holdings are capped at 5% and rebalanced semiannually to ensure that the fund remains sufficiently diversified. Furthermore, its top 10 holdings account for just 38.6% of assets. Below is an overview of QUAL’s top 10 holdings using TipRanks’ holdings tool.
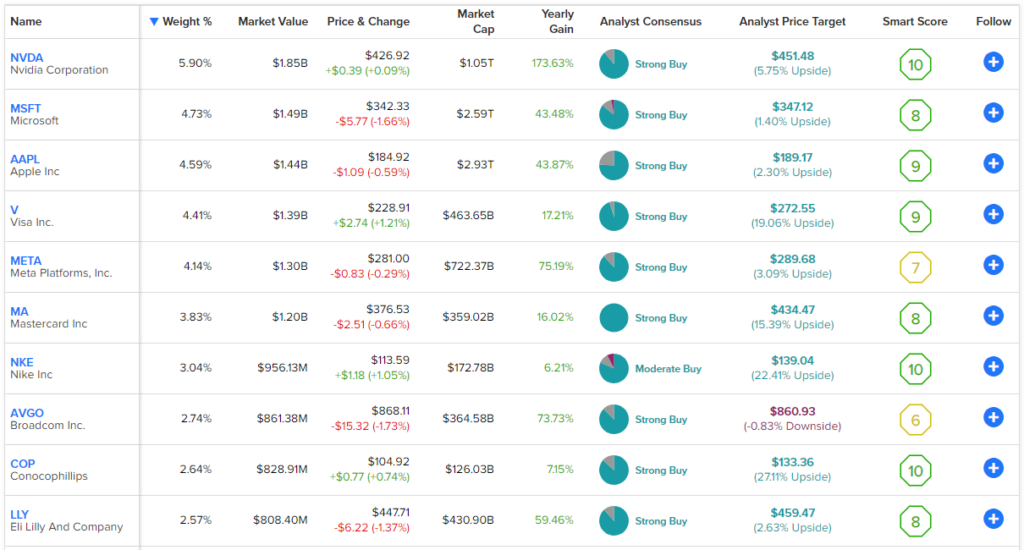
Nvidia (NASDAQ:NVDA) is the toast of the town in the investing world these days thanks to its key role in the rise of artificial intelligence (AI), so it’s unsurprising that it’s QUAL’s top holding with a weighting of 5.9%.
After Nvidia, tech giants Microsoft (NASDAQ:MSFT) and Apple (NASDAQ:AAPL), the two most valuable companies in the world by market cap, are QUAL’s next two largest holdings. However, QUAL isn’t simply a large-cap tech ETF — within the top 10, you’ll also find healthcare companies like Eli Lilly (NYSE:LLY), global payment networks Visa (NYSE:V) and Mastercard (NASDAQ:MA), and even an oil major, ConocoPhillips (NYSE:COP).
Indeed, the fund is well-diversified across sectors, with the top sector, information technology, accounting for a 29.65% weighting, followed by healthcare (13.1%) and financials (11.74%). All other sectors have less than a 10% weighting. Information technology currently makes up a larger portion of the fund due to the rallies that its top holdings (tech stocks like Meta, Nvidia, Microsoft, and Apple) have seen in 2023.
BlackRock’s definition of high quality seems to correlate well with TipRanks’ Smart Scores. The Smart Score is TipRanks’ proprietary quantitative stock scoring system. It gives stocks a score from 1 to 10 based on eight market key factors. The score is data-driven and does not involve any human intervention.
Eight of QUAL’s top 10 holdings have Smart Scores of 8 or above, led by Nvidia, which boasts a ‘Perfect 10’ rating. QUAL stock itself has a Smart Score of 8 out of 10.

Another nice thing about QUAL is that while it focuses on blue-chip investments, it isn’t paying an egregious valuation for them. The ETF’s average price-to-earnings ratio is 17.8, which is actually a slight discount to the S&P 500.
Lastly, the fund deserves credit for its tax efficiency — it has never had to pay a capital gains distribution over the years.
Dividend and Fees
QUAL pays out a dividend that currently yields 1.3%. This isn’t a dividend yield that really stands out in the current market environment, but it helps to add to total returns over time. The ETF also features a reasonable expense ratio of 0.15%.
Solid Past Performance
The efficacy of QUAL’s strategy seems to be borne out in its results. As of the end of the most recent quarter, it boasts double-digit annualized total returns over both a three and five-year basis, with annualized returns of 17.0% and 10.2% over each of those timeframes, respectively. Since its inception in 2013, the fund has returned a solid 11.6% on an annualized basis.
Is QUAL Stock a Buy, According to Analysts?
Analysts are relatively bullish on QUAL. It enjoys a Moderate Buy consensus rating from analysts, and the average QUAL stock price target of $144.62 implies upside potential of 8.3%.
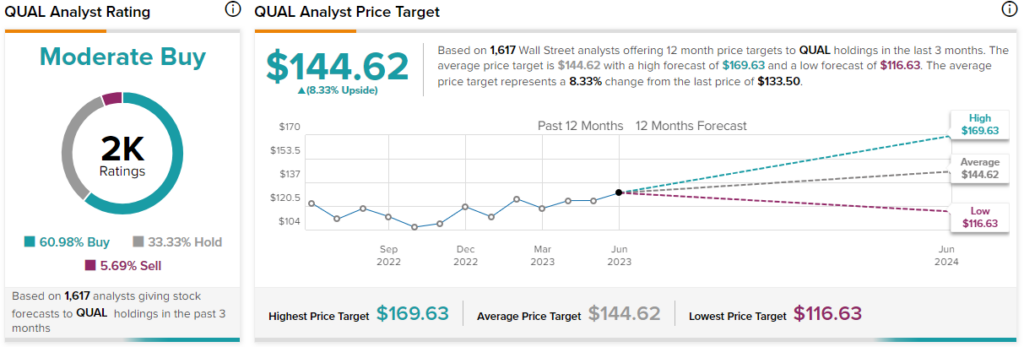
Of the 1,617 analyst ratings on QUAL, 61% are Buys, 33.3% are Holds, and 5.7% are Sells.
Investor Takeaway: Does Quality Matter?
You can’t really argue with the type of results that QUAL has produced for its investors, and you could certainly have done a lot worse than investing in QUAL over the years with many of the other ETFs out there. Double-digit annualized returns over the long term are nothing to complain about.
On the other hand, despite its rigorous approach to screening for quality, QUAL’s total returns are not all that different from those of a broad-market S&P 500 (SPX) ETF like the Vanguard S&P 500 ETF (NYSEARCA:VOO) or the SPDR S&P 500 ETF Trust (NYSEARCA:SPY) which both slightly outperformed QUAL over the same three- and five-year time frames.
As of the end of the most recent quarter, VOO posted total annualized returns over the three- and five-year time periods of 18.6% and 11.1%, respectively, while SPY had returns of 18.5% and 11% over the same periods. These ETFs both outperformed QUAL over the past three and five years despite their simple strategy of just investing in the S&P 500 without running additional screens for quality.
Further, the Invesco QQQ Trust (NASDAQ:QQQ), which invests in the Nasdaq 100 Index (NDX), has returned 19.8% and 15.7% over the past three and five years, respectively.
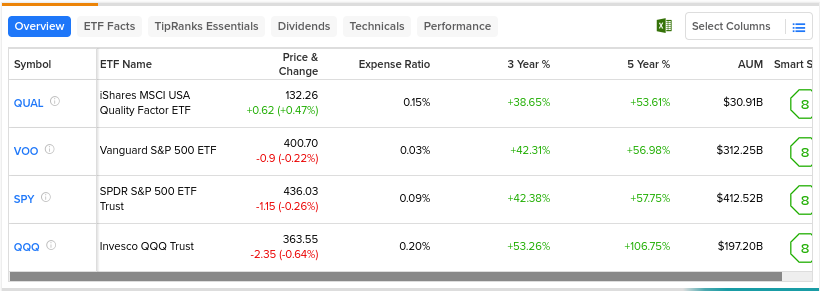
Below, you can check out a comparison of these four ETFs using TipRanks’ ETF Comparison Tool, which is customizable and allows users to compare up to 20 ETFs at once across a variety of factors.
None of this is to say that there is anything wrong with QUAL. It is a good ETF that has helped its investors to compound wealth over time. Past performance is no guarantee of future results, so it’s also possible that QUAL could outperform these peers in the future. Additionally, QUAL’s screens for low leverage and earnings consistency could help it to gain a leg up on the competition in the event of a recession.
However, It’s just worth pointing out that there are other major, well-known ETFs that have generated even better results with less complex strategies. Note that VOO (0.03%) and SPY (0.09%) have lower expense ratios than QUAL, while QQQ comes in a bit higher (0.2%).
These ETFs also end up overlapping quite a bit, as the top stocks in QUAL’s high-quality index are also among the largest S&P 500 and Nasdaq stocks by market cap, so the same names like Nvidia, Apple, and Microsoft account for large positions in all four ETFs.