E-commerce giant Amazon (AMZN) has become a market standout due to its strong position in retail, supported by an extensive logistics network and diverse product offerings. Its strategic investments in growth areas like artificial intelligence and healthcare also show significant potential. Over the past year, AMZN stock has gained more than 41%, outperforming the S&P 500 Index’s (SPX) rally of 33%. Despite its impressive gains, technical indicators suggest that Amazon is a Strong Buy, implying further upside from current levels.
Meet Your ETF AI Analyst
- Discover how TipRanks' ETF AI Analyst can help you make smarter investment decisions
- Explore ETFs TipRanks' users love and see what insights the ETF AI Analyst reveals about the ones you follow.
Analyzing AMZN’s Technical Indicators
According to TipRanks’ easy-to-understand technical analysis tool, AMZN stock is currently on an upward trend. The Moving Averages Convergence Divergence (MACD) indicator, a crucial tool for understanding momentum and potential price direction shifts, is currently signaling a Buy.
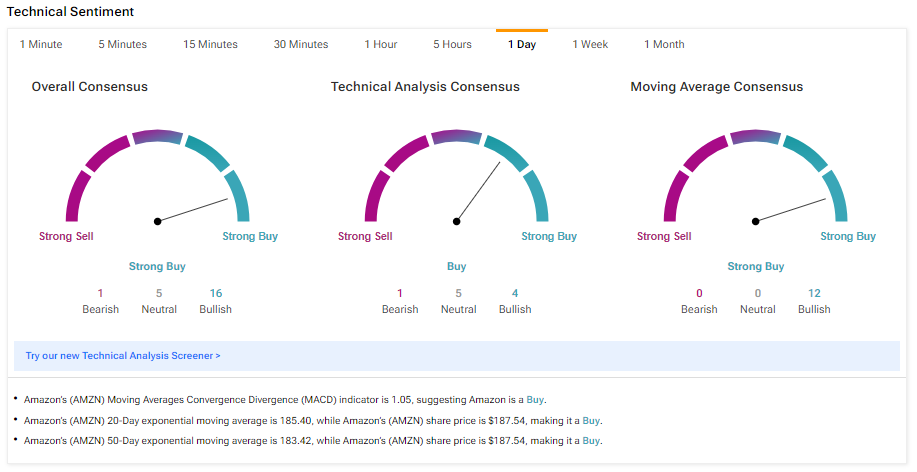
Further, AMZN’s 50-day EMA (exponential moving average) is 183.42, while its price is $187.54, implying a bullish signal. Further, its shorter duration EMA (20 days) also signals an uptrend.
Another technical indicator, Williams %R, helps traders determine if a stock is overbought or oversold. In the case of Amazon, Williams %R is currently indicating a buy signal, suggesting that the stock is not overbought and has more room to run.
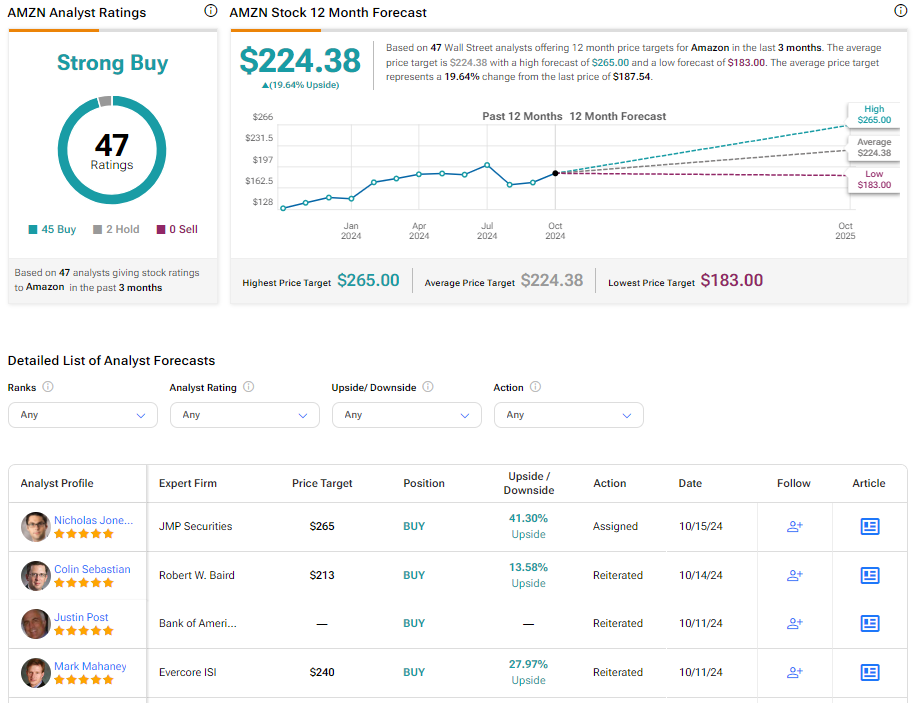
What Is the Price Target for AMZN?
Turning to Wall Street, AMZN has a Strong Buy consensus rating based on 45 Buys and two Holds assigned in the last three months. At $224.38, the average Amazon price target implies a 19.64% upside potential.