Micron (MU) stock is down 6.37% in pre-market trading Monday as semiconductor stocks come under pressure. The sell-off follows concerns about the pace of AI development and a sharp decline in South Korea’s KOSPI, which has weighed on chip stocks across the region. Micron closed at $975.26 on Friday and is trading around $913.09 in pre-market trading.
Despite the decline, Wall Street remains bullish on MU stock. The average price target is $1,563.93, representing 60.36% upside from Friday’s closing price.
In this article, we take a look at MU’s key technical indicators and what the charts suggest about the stock’s next move as of September 14, 2026.
Technical Analysis with TipRanks
Notably, technical analysis studies a stock’s past price movements and trading volume to predict future trends. It uses tools like moving averages, RSI, and chart patterns to identify Buy or Sell signals. In this context, TipRanks’ Technical Analysis tool simplifies this process by combining multiple indicators into one easy-to-understand dashboard for users.
Micron’s Technical Analysis
According to TipRanks’ technical analysis, MU currently has a positive signal. Based on its overall consensus, the stock carries a Buy rating. Its moving averages also point to a Buy signal, with nine bullish and three bearish signals.
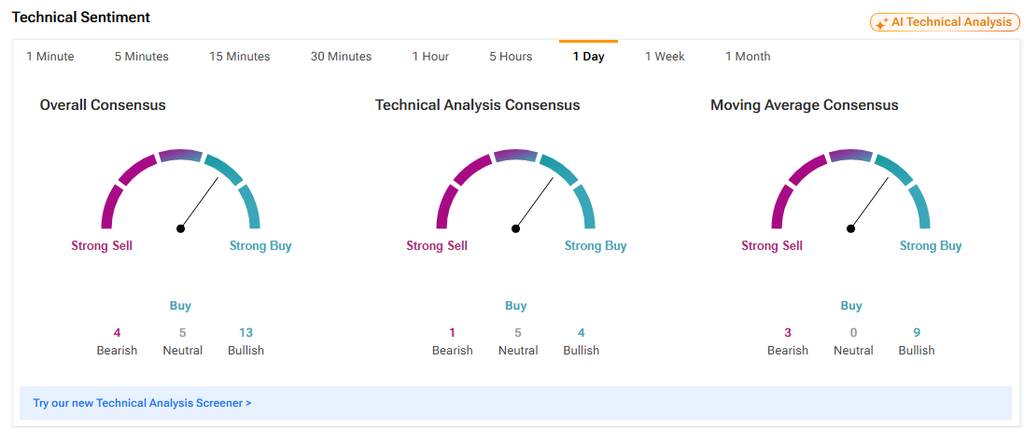
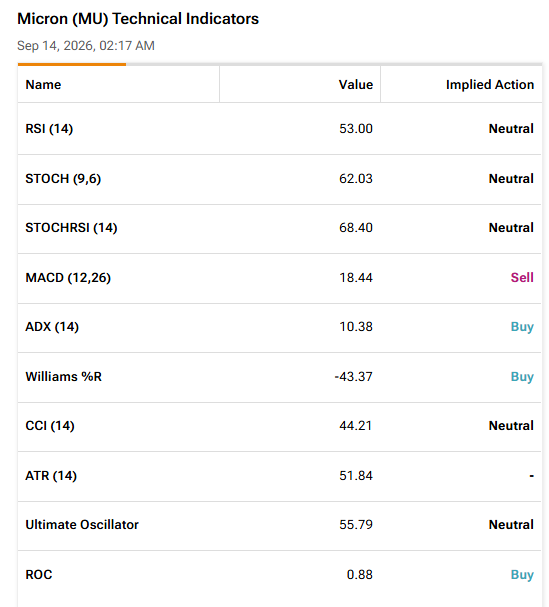
Micron’s moving average indicators show a mixed but generally positive technical picture. The Moving Average Convergence Divergence (MACD) indicator stands at 18.44, giving the stock a Sell signal.

Meanwhile, Micron’s stock is trading at $975.26, above its 50-day exponential moving average (EMA) of $932.01. This indicates that the stock’s medium-term uptrend remains intact.
More Technical Indicators for MU
Another key indicator is the Relative Strength Index (RSI), which measures whether a stock is overbought or oversold. MU’s RSI stands at 53.00, placing it in neutral territory. This suggests that the stock is neither overbought nor oversold at current levels.
The Average Directional Index (ADX), which measures the strength of a stock’s trend, stands at 10.38 and gives a Buy signal. This points to a positive reading for MU’s current trend.
Meanwhile, the Rate of Change (ROC) stands at 0.88, giving the stock a Buy signal. A positive ROC means the stock price is higher than it was during the measured period, pointing to strengthening momentum.
Is Micron Stock a Buy?
According to TipRanks, Micron stock carries a Strong Buy consensus rating based on 29 Buys and one Hold assigned over the past three months. The average MU price target of $1,563.93 implies over 60% upside from current levels.