Dividend Calendar - Dec 19, 2023
Showing companies with ex-dividend date as Dec 19, 2023
Name | Dividend Yield | Analyst Consensus | Smart Score | Dividend Amount | Payment Date | Payout Ratio | Company | Market Cap | Follow |
|---|---|---|---|---|---|---|---|---|---|
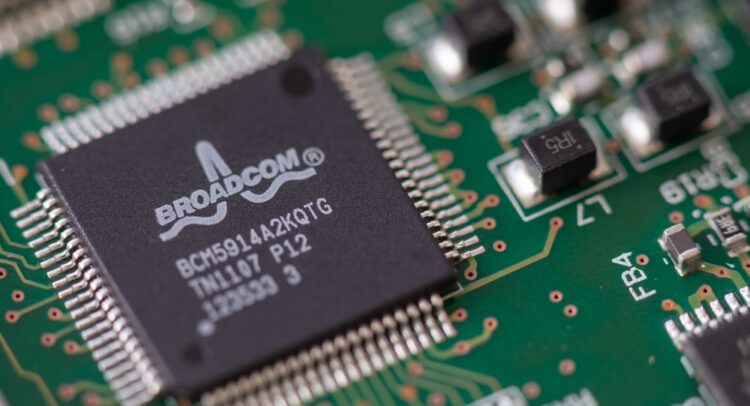
| 1.18% | xxxxxxxxxxxxx | $0.53 | 61.25% | Broadcom | $802.45B | ||||
| 3.31% | xxxxxxxxxxxxx | $0.69 | 52.88% | Medtronic | $107.17B | ||||
| 5.33% | xxxxxxxxxxxxx | $0.28 | 98.77% | Main Street Capital | $4.86B | ||||
| 0.58% | xxxxxxxxxxxxx | $0.21 | 75.92% | Vistra Energy | $48.15B | ||||
| 15.73% | xxxxxxxxxxxxx | $0.06 | 143.45% | Nordic American Tanker | $559.57M | ||||
| 19.13% | xxxxxxxxxxxxx | $0.83 | 133.88% | Ecopetrol SA | $17.22B | ||||
| 6.37% | xxxxxxxxxxxxx | $0.10 | -412.37% | UWM Holding | $9.80B | ||||
| 8.60% | xxxxxxxxxxxxx | $0.23 | 54.42% | Western Union | $3.71B | ||||
| 9.30% | xxxxxxxxxxxxx | $0.16 | 117.64% | Redwood | $921.90M | ||||
| 6.49% | xxxxxxxxxxxxx | $0.51 | 34.63% | Dine Brands Global | $495.36M | ||||
| 8.04% | xxxxxxxxxxxxx | $0.53 | 98.24% | Fidus Investment | $728.83M | ||||
| 14.39% | xxxxxxxxxxxxx | $0.38 | 103.85% | WhiteHorse | $248.24M | ||||
| 1.07% | xxxxxxxxxxxxx | $0.09 | 27.44% | Tootsie Roll | $2.58B | ||||
| 5.41% | xxxxxxxxxxxxx | $0.25 | -180.18% | BRT Apartments | $360.14M | ||||
| 4.41% | xxxxxxxxxxxxx | $0.07 | -10.60% | Mercer International | $446.70M | ||||
| 6.19% | xxxxxxxxxxxxx | $0.45 | 110.86% | One Liberty Properties | $623.43M | ||||
| 4.49% | xxxxxxxxxxxxx | $0.24 | 53.87% | Ituran Location And Control | $625.78M | ||||
| 8.44% | xxxxxxxxxxxxx | $2.00 | 500.00% | Saga Communications | $75.33M | ||||
| 7.79% | xxxxxxxxxxxxx | $0.70 | 278.65% | Chicago Atlantic BDC | $294.50M | ||||
| 6.41% | xxxxxxxxxxxxx | $0.22 | 46.74% | Burnham Holdings | $62.28M | ||||
| ― | xxxxxxxxxxxxx | $0.33 | ― | Diamond Bancshares | ― | ||||
| ― | xxxxxxxxxxxxx | $0.45 | ― | Lake Ridge Bancorp | $113.93M |
Rows:

News
FAQ
What are the 3 important dates for dividends?
When it comes to dividend stocks, investors should remain aware of the ex-dividend date, record date and payment date. The ex-dividend date determines which shareholders receive will receive dividend. The record date is the day on which a shareholder must be in the company’s books in order to receive the dividend. And finally, the payment date is the date on which the dividend is paid to shareholders.
Is it better to buy a stock before or after the ex-dividend date?
In order to receive a company’s dividend, an investor must purchase the stock one or more days before its ex-dividend date. If the stock is purchased on or after the ex-dividend date, an investor will not receive the dividend.
What is the highest dividend-paying stock?
The highest dividend-paying stock can vary, given the ever-changing nature of the stock market. Instead, investors often target the best high-dividend stocks, which are known for their dependable and attractive returns.
How often are dividends paid?
Dividends are typically paid on a quarterly basis, but companies can also pay dividends on a monthly or annual basis. Dividends paid out as a special dividend are one-time payments declared by the company.
Do I get a dividend if I sell on ex-date?
Yes, if an investor sells out of a position on the ex-dividend date, the investor will still be the owner of the company’s shares as per the record in company books.
Investors should receive a dividend roughly two weeks after the ex-dividend date.
Investors should receive a dividend roughly two weeks after the ex-dividend date.


