Working with TipRanks
Follow Us


Stocks
ETFs
Options
Commodities
Crypto
Currency
Research Tools
Calendars
Economic Indicators
Calculators
Education
About Us
Working with TipRanks
Follow Us
Barrick Gold Corporation (GOLD)
NYSE:GOLD
Barrick Gold (GOLD) Stock Price & Analysis
8,552 Followers
GOLD Stock Chart & Stats
Day’s Range$0 - $0
52-Week Range$13.65 - $20.24
Previous Close$16.48
Volume11.21M
Average Volume (3M)23.29M
Market Cap
$30.69B
Enterprise Value$39.73B
Total Cash (Recent Filing)$4.15B
Total Debt (Recent Filing)$4.76B
Price to Earnings (P/E)24.0
Beta0.78
Next Earnings
May 01, 2024EPS Estimate
$0.18Last Dividend Ex-Date
Feb 28, 2024Dividend Yield2.31%
Share Statistics
EPS (TTM)0.72
Shares Outstanding1,755,569,554
10 Day Avg. Volume34,079,468
30 Day Avg. Volume23,288,902
Standard Deviation0.11
R-Squared0.08
Alpha0.00367
Financial Highlights & Ratios
Price to Book (P/B)1.58
Price to Sales (P/S)2.54
Price to Cash Flow (P/CF)7.80
P/FCF Ratio23.00
Enterprise Value/Market CapN/A
Enterprise Value/Revenue3.49
Enterprise Value/Gross Profit11.47
Enterprise Value/Ebitda7.44
Forecast
1Y Price Target
$21.30Price Target Upside28.27% Upside
Rating ConsensusStrong Buy
Number of Analyst Covering12
Barrick Gold News


Bulls Say, Bears Say
Bulls Say
Financial PerformanceAnalyst reiterates Buy rating based on GOLD's high-quality assets, strong free cash flow, and solid long-term production growth.
Operational EfficiencyCopper AISC is expected to fall quarter-over-quarter, signaling improved operational efficiency and cost management.
Shareholder ValueGOLD announced a new $1 billion share buy-back program, which should offer strong support for the shares.
Bears Say
Asset RiskThe Malian government's aim to expropriate the Loulo-Gounkoto gold mining complex poses a significant threat to the asset base and future earnings.
Increased CostsHigher-than-expected costs and directional guidance on quarter-over-quarter increases could compress margins, affecting the bottom line.
Production ShortfallGold and copper production and sales volume broadly missed expectations, indicating a potential decrease in revenue and profitability.
---
Ownership Overview
0.93% Insiders
18.94% Mutual Funds
11.64% Other Institutional Investors
68.49% Public Companies and Individual Investors
GOLD FAQ
What was Barrick Gold Corporation’s price range in the past 12 months?
Barrick Gold Corporation lowest stock price was $13.64 and its highest was $20.24 in the past 12 months.
What is Barrick Gold Corporation’s market cap?
Currently, no data Available
When is Barrick Gold Corporation’s upcoming earnings report date?
Barrick Gold Corporation’s upcoming earnings report date is May 01, 2024 which is in 8 days.
How were Barrick Gold Corporation’s earnings last quarter?
Barrick Gold Corporation released its earnings results on Feb 14, 2024. The company reported $0.265 earnings per share for the quarter, beating the consensus estimate of $0.197 by $0.068.
Is Barrick Gold Corporation overvalued?
According to Wall Street analysts Barrick Gold Corporation’s price is currently Undervalued.
Does Barrick Gold Corporation pay dividends?
Barrick Gold Corporation pays a Quarterly dividend of $0.1 which represents an annual dividend yield of 2.31%. See more information on Barrick Gold Corporation dividends here
What is Barrick Gold Corporation’s EPS estimate?
Barrick Gold Corporation’s EPS estimate is $0.18.
How many shares outstanding does Barrick Gold Corporation have?
Barrick Gold Corporation has 1,755,569,600 shares outstanding.
What happened to Barrick Gold Corporation’s price movement after its last earnings report?
Barrick Gold Corporation reported an EPS of $0.265 in its last earnings report, beating expectations of $0.197. Following the earnings report the stock price went down -0.641%.
Which hedge fund is a major shareholder of Barrick Gold Corporation?
Currently, no hedge funds are holding shares in GOLD
---
Barrick Gold Stock Smart Score
Outperform
1
2
3
4
5
6
7
8
9
10
Analyst Consensus
Strong Buy
Average Price Target:
$21.30 (28.27% Upside)
$21.30 (28.27% Upside)
Blogger Sentiment
Bullish
GOLD Sentiment 95%
Sector Average 73%
Sector Average 73%
Insider Transactions
Bought Shares
Worth $378.4K over
the Last 3 Months
the Last 3 Months
Crowd Wisdom
Negative
Last 7 Days >0.1%
Last 30 Days ▼ 0.5%
Last 30 Days ▼ 0.5%
News Sentiment
Bullish
Bullish news 60%
Bearish news 40%
Bearish news 40%
Technicals
SMA
Positive
20 days / 200 days
Momentum
-14.11%
12-Months-Change
Fundamentals
Return on Equity
5.52%
Trailing 12-Months
Asset Growth
-0.34%
Trailing 12-Months
Company Description
Barrick Gold Corporation
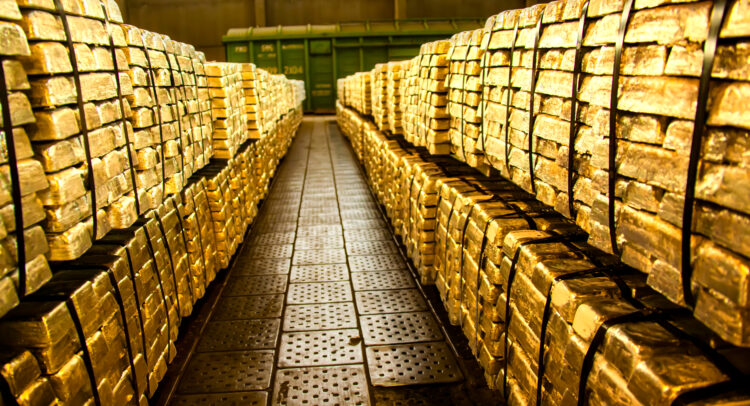
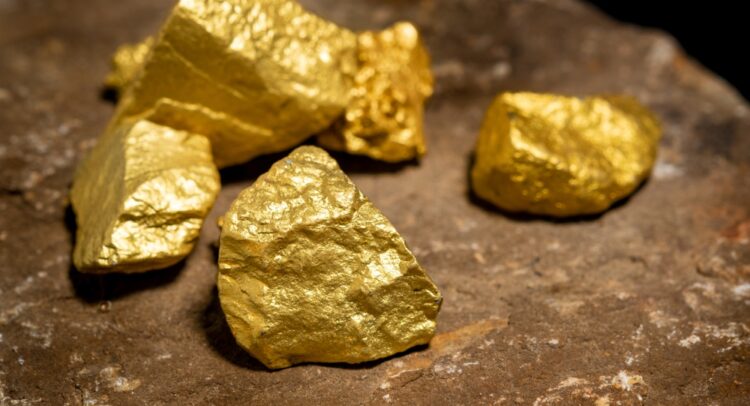
Canada-based Barrick Gold Corp. is engaged in the production and sale of gold and copper, as well as related activities such as exploration and mine development.
---
GOLD Company Deck
---
GOLD Earnings Call
Q4 2024
0:00 / 0:00
---
GOLD Stock 12 Months Forecast
Average Price Target
$21.30
▲(28.27% Upside)
Technical Analysis
Best Analysts Covering GOLD
1 Year
1 Year Success Rate
8/14 ratings generated profit
1 Year Average Return
+1.78%
reiterated a buy rating 2 months ago
Copying Ingrid Rico's trades and holding each position for 1 Year would result in 57.14% of your transactions generating a profit, with an average return of +1.78% per trade.
---