Working with TipRanks
Follow Us


Stocks
ETFs
Options
Commodities
Crypto
Currency
Research Tools
Calendars
Economic Indicators
Calculators
Education
About Us
Working with TipRanks
Follow Us
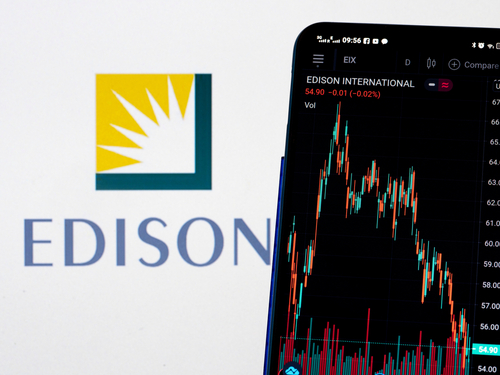
Edison International (EIX)
NYSE:EIX
Edison International (EIX) Stock Price & Analysis
783 Followers
EIX Stock Chart & Stats
Day’s Range$0 - $0
52-Week Range$57.52 - $72.41
Previous Close$69.93
Volume1.44M
Average Volume (3M)2.24M
Market Cap
$26.90B
Enterprise Value$63.32B
Total Cash (Recent Filing)$195.00M
Total Debt (Recent Filing)$34.71B
Price to Earnings (P/E)22.5
Beta0.83
Next Earnings
Apr 30, 2024EPS Estimate
$1.2Last Dividend Ex-Date
Mar 27, 2024Dividend Yield4.34%
Share Statistics
EPS (TTM)3.11
Shares Outstanding384,524,276
10 Day Avg. Volume1,492,739
30 Day Avg. Volume2,241,054
Standard Deviation0.08
R-Squared0.44
Alpha-0.00251
Financial Highlights & Ratios
Price to Book (P/B)1.95
Price to Sales (P/S)1.57
Price to Cash Flow (P/CF)N/A
P/FCF Ratio25.10
Enterprise Value/Market CapN/A
Enterprise Value/Revenue4.82
Enterprise Value/Gross Profit5.07
Enterprise Value/Ebitda21.58
Forecast
1Y Price Target
$76.56Price Target Upside8.35% Upside
Rating ConsensusModerate Buy
Number of Analyst Covering10
Edison International News


PremiumCompany Announcements
Edison International Engages Investors with Insightful Presentation
PremiumCompany Announcements
Edison International Engages Investors with New Presentation
Ownership Overview
0.53% Insiders
35.64% Mutual Funds
27.35% Other Institutional Investors
36.49% Public Companies and
Individual Investors
Risk Analysis
Main Risk Category
ProductionRisks related to the company’s ability to manufacture goods and services
Website Traffic
 Sorry, No Data Available
There is no website visitor data available for this stock.
---
EIX FAQ
What was Edison International’s price range in the past 12 months?
Edison International lowest stock price was $57.52 and its highest was $72.41 in the past 12 months.
What is Edison International’s market cap?
Currently, no data Available
When is Edison International’s upcoming earnings report date?
Edison International’s upcoming earnings report date is Apr 30, 2024 which is in 7 days.
How were Edison International’s earnings last quarter?
Edison International released its earnings results on Feb 22, 2024. The company reported $1.28 earnings per share for the quarter, beating the consensus estimate of $1.162 by $0.118.
Is Edison International overvalued?
According to Wall Street analysts Edison International’s price is currently Undervalued.
Does Edison International pay dividends?
Edison International pays a Quarterly dividend of $0.78 which represents an annual dividend yield of 4.34%. See more information on Edison International dividends here
What is Edison International’s EPS estimate?
Edison International’s EPS estimate is $1.2.
How many shares outstanding does Edison International have?
Edison International has 384,680,180 shares outstanding.
What happened to Edison International’s price movement after its last earnings report?
Edison International reported an EPS of $1.28 in its last earnings report, beating expectations of $1.162. Following the earnings report the stock price went up 1.245%.
Which hedge fund is a major shareholder of Edison International?
Among the largest hedge funds holding Edison International’s share is Pzena Investment Management LLC. It holds Edison International’s shares valued at 951M.
---
Edison International Stock Smart Score
Neutral
1
2
3
4
5
6
7
8
9
10
Analyst Consensus
Moderate Buy
Average Price Target:
$76.56 (8.35% Upside)
$76.56 (8.35% Upside)
Blogger Sentiment
Bullish
EIX Sentiment 71%
Sector Average 72%
Sector Average 72%
Hedge Fund Trend
Increased
By 61.9K Shares
Last Quarter.
Last Quarter.
Crowd Wisdom
Very Negative
Last 7 Days ▼ 1.1%
Last 30 Days ▼ 7.6%
Last 30 Days ▼ 7.6%
News Sentiment
Neutral
Bullish news 50%
Bearish news 50%
Bearish news 50%
Technicals
SMA
Positive
20 days / 200 days
Momentum
0.50%
12-Months-Change
Fundamentals
Return on Equity
8.25%
Trailing 12-Months
Asset Growth
4.76%
Trailing 12-Months
Company Description
Edison International
Founded in 1886 and based in California, Edison International is a renewable energy company, which through its subsidiaries, generates and distributes electric power, and invests in energy services and technologies.
---
EIX Company Deck
---
EIX Earnings Call
Q4 2024
0:00 / 0:00
---
EIX Stock 12 Months Forecast
Average Price Target
$76.56
▲(8.35% Upside)
Technical Analysis
Best Analysts Covering EIX
1 Year
1 Year Success Rate
25/30 ratings generated profit
1 Year Average Return
+8.86%
reiterated a buy rating 2 months ago
Copying Shelby Tucker's trades and holding each position for 1 Year would result in 83.33% of your transactions generating a profit, with an average return of +8.86% per trade.
---