Working with TipRanks
Follow Us


Stocks
ETFs
Options
Commodities
Crypto
Currency
Research Tools
Calendars
Economic Indicators
Calculators
Education
About Us
Working with TipRanks
Follow Us
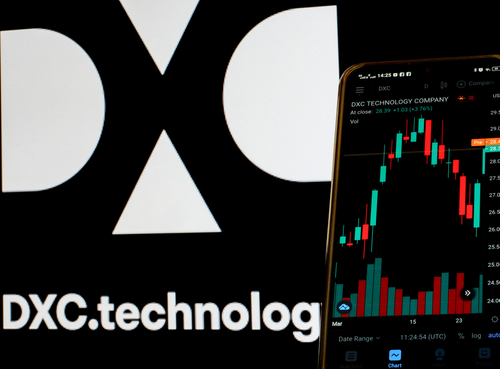
DXC Technology (DXC)
NYSE:DXC
DXC Technology (DXC) Stock Price & Analysis
1,386 Followers
DXC Stock Chart & Stats
Day’s Range$0 - $0
52-Week Range$18.61 - $28.89
Previous Close$19.79
Volume1.25M
Average Volume (3M)2.65M
Market Cap
$3.62B
Enterprise Value$7.57B
Total Cash (Recent Filing)$1.69B
Total Debt (Recent Filing)$5.38B
Price to Earnings (P/E)-10.4
Beta1.36
Next Earnings
May 22, 2024EPS Estimate
$0.83Next Dividend Ex-DateN/A
Dividend YieldN/A
Share Statistics
EPS (TTM)-1.91
Shares Outstanding182,870,646
10 Day Avg. Volume1,611,634
30 Day Avg. Volume2,648,135
Standard Deviation0.16
R-Squared0.39
Alpha-0.03
Financial Highlights & Ratios
Price to Book (P/B)14.50
Price to Sales (P/S)1.01
Price to Cash Flow (P/CF)1.30
P/FCF Ratio1.40
Enterprise Value/Market CapN/A
Enterprise Value/Revenue0.55
Enterprise Value/Gross Profit2.38
Enterprise Value/Ebitda9.64
Forecast
1Y Price Target
$22.13Price Target Upside13.02% Upside
Rating ConsensusModerate Sell
Number of Analyst Covering8
DXC Technology News

PremiumCompany Announcements
DXC Technology Announces Executive Leadership Transition

PremiumCompany Announcements
DXC Technology Addresses Recent Report in Press Release
PremiumCompany Announcements
DXC Technology Appoints Raul Fernandez as CEOBulls Say, Bears Say
Bulls Say
Executive LeadershipWith the interim leader now officially at the helm as CEO, there's a clear strategic vision for the company's near-term performance.
Financial GuidanceThe company has re-affirmed its financial guidance, signaling confidence in its fiscal strategy and stability to investors.
Leadership StabilityThe concerns from a surprise CEO succession have been alleviated as the interim CEO assumes the role permanently, with a reinforced focus on execution.
Bears Say
Financial PerformanceDXC's reported quarter and updated full year guidance was lackluster, with lowered growth and margin projections.
Leadership ChangeMike Salvino stepping down as Chairman/CEO/President, effective immediately, adds an additional layer of uncertainty to DXC's challenging turnaround.
Operational ChallengesDXC will be challenged to turn around its revenue decline while also improving profitability in a challenging IT services environment.
---
Ownership Overview
3.62% Insiders
36.89% Mutual Funds
39.30% Other Institutional Investors
20.20% Public Companies and
Individual Investors
Risk Analysis
Main Risk Category
Finance & CorporateFinancial and accounting risks. Risks related to the execution of corporate activity and strategy
Website Traffic
 Sorry, No Data Available
There is no website visitor data available for this stock.
---
DXC FAQ
What was DXC Technology’s price range in the past 12 months?
DXC Technology lowest stock price was $18.61 and its highest was $28.89 in the past 12 months.
What is DXC Technology’s market cap?
Currently, no data Available
When is DXC Technology’s upcoming earnings report date?
DXC Technology’s upcoming earnings report date is May 22, 2024 which is in 33 days.
How were DXC Technology’s earnings last quarter?
DXC Technology released its earnings results on Feb 01, 2024. The company reported $0.87 earnings per share for the quarter, beating the consensus estimate of $0.774 by $0.096.
Is DXC Technology overvalued?
According to Wall Street analysts DXC Technology’s price is currently Undervalued.
Does DXC Technology pay dividends?
DXC Technology does not currently pay dividends.
What is DXC Technology’s EPS estimate?
DXC Technology’s EPS estimate is $0.83.
How many shares outstanding does DXC Technology have?
DXC Technology has 182,870,650 shares outstanding.
What happened to DXC Technology’s price movement after its last earnings report?
DXC Technology reported an EPS of $0.87 in its last earnings report, beating expectations of $0.774. Following the earnings report the stock price went up 0.092%.
Which hedge fund is a major shareholder of DXC Technology?
Among the largest hedge funds holding DXC Technology’s share is Glenview Capital Management LLC. It holds DXC Technology’s shares valued at 297M.
---
DXC Technology Stock Smart Score
Neutral
1
2
3
4
5
6
7
8
9
10
Analyst Consensus
Moderate Sell
Average Price Target:
$22.13 (13.02% Upside)
$22.13 (13.02% Upside)
Blogger Sentiment
Bullish
DXC Sentiment 66%
Sector Average 70%
Sector Average 70%
Hedge Fund Trend
Increased
By 3.2M Shares
Last Quarter.
Last Quarter.
Insider Transactions
Sold Shares
Worth $254.7K over
the Last 3 Months
the Last 3 Months
Crowd Wisdom
Very Negative
Last 7 Days ▼ 1.3%
Last 30 Days ▼ 6.0%
Last 30 Days ▼ 6.0%
Technicals
SMA
Negative
20 days / 200 days
Momentum
-22.87%
12-Months-Change
Fundamentals
Return on Equity
-12.02%
Trailing 12-Months
Asset Growth
-18.42%
Trailing 12-Months
Company Description
DXC Technology
DXC Technology Co. provides technology consulting, outsourcing and support services. It operates through the following segments: Global Business Services (GBS) and Global Infrastructure Services (GIS). The GBS segment provides technology solutions that help clients address challenges and accelerates the digital transformations that is tailored to each client's specific objectives. The GIS segment offers to deliver predictable outcomes and measurable results, while reducing business risk and operational costs for clients. The USPS segment delivers IT services and business solutions to all levels of government in the United States. The company was founded on 19th May, 2016 and is headquartered in Tysons, VA.
---
DXC Company Deck
---
DXC Earnings Call
Q3 2024
0:00 / 0:00
---
DXC Revenue Breakdown
51.77% Global Infrastructure Services
48.23% Global Business Services
---
DXC Stock 12 Months Forecast
Average Price Target
$22.13
▲(13.02% Upside)
Technical Analysis
Hewlett Packard Enterprise
―
International Business Machines
―
Caci International
―
CGI Group
―
Best Analysts Covering DXC
1 Year
1 Year Success Rate
17/18 ratings generated profit
1 Year Average Return
+36.24%
reiterated a sell rating 3 months ago
Copying Jason Kupferberg's trades and holding each position for 1 Year would result in 94.44% of your transactions generating a profit, with an average return of +36.24% per trade.
---