



Earlier this week, we talked about the USD-CAD‘s major economic catalysts and critical support zones to watch for. We discussed how the critical price level short sellers were waiting for was a daily close at or below $1.3498. Well, this occurred on Thursday.

Two other important technical support levels were also breached on Thursday: the 21-day and 200-day moving averages. While the drop and close below those moving averages is a big warning sign, it’s important to ask, “How legitimate is this break?” That’s where oscillators come into play. For this analysis, we are using Connie Brown’s Composite Index and the Detrended Price Oscillator (DPO).
How Legitimate Is the Move Lower?
The Composite Index shows a very sharp move lower, almost out of proportion with how price moved. However, the Composite Index isn’t at extremes, so there is room for further downside. Additionally, the DPO moved below the zero line, which is a strong bearish warning sign. It, too, is not at extremes. Therefore, the move appears legitimate.
The Composite Index is the Relative Strength Index (RSI) with a momentum calculation inside. As a result, it can detect divergences that the RSI can not. On the other hand, the DPO isolates short-term cycles from long-term trends by comparing past prices to a shifted moving average, revealing overbought or oversold conditions.
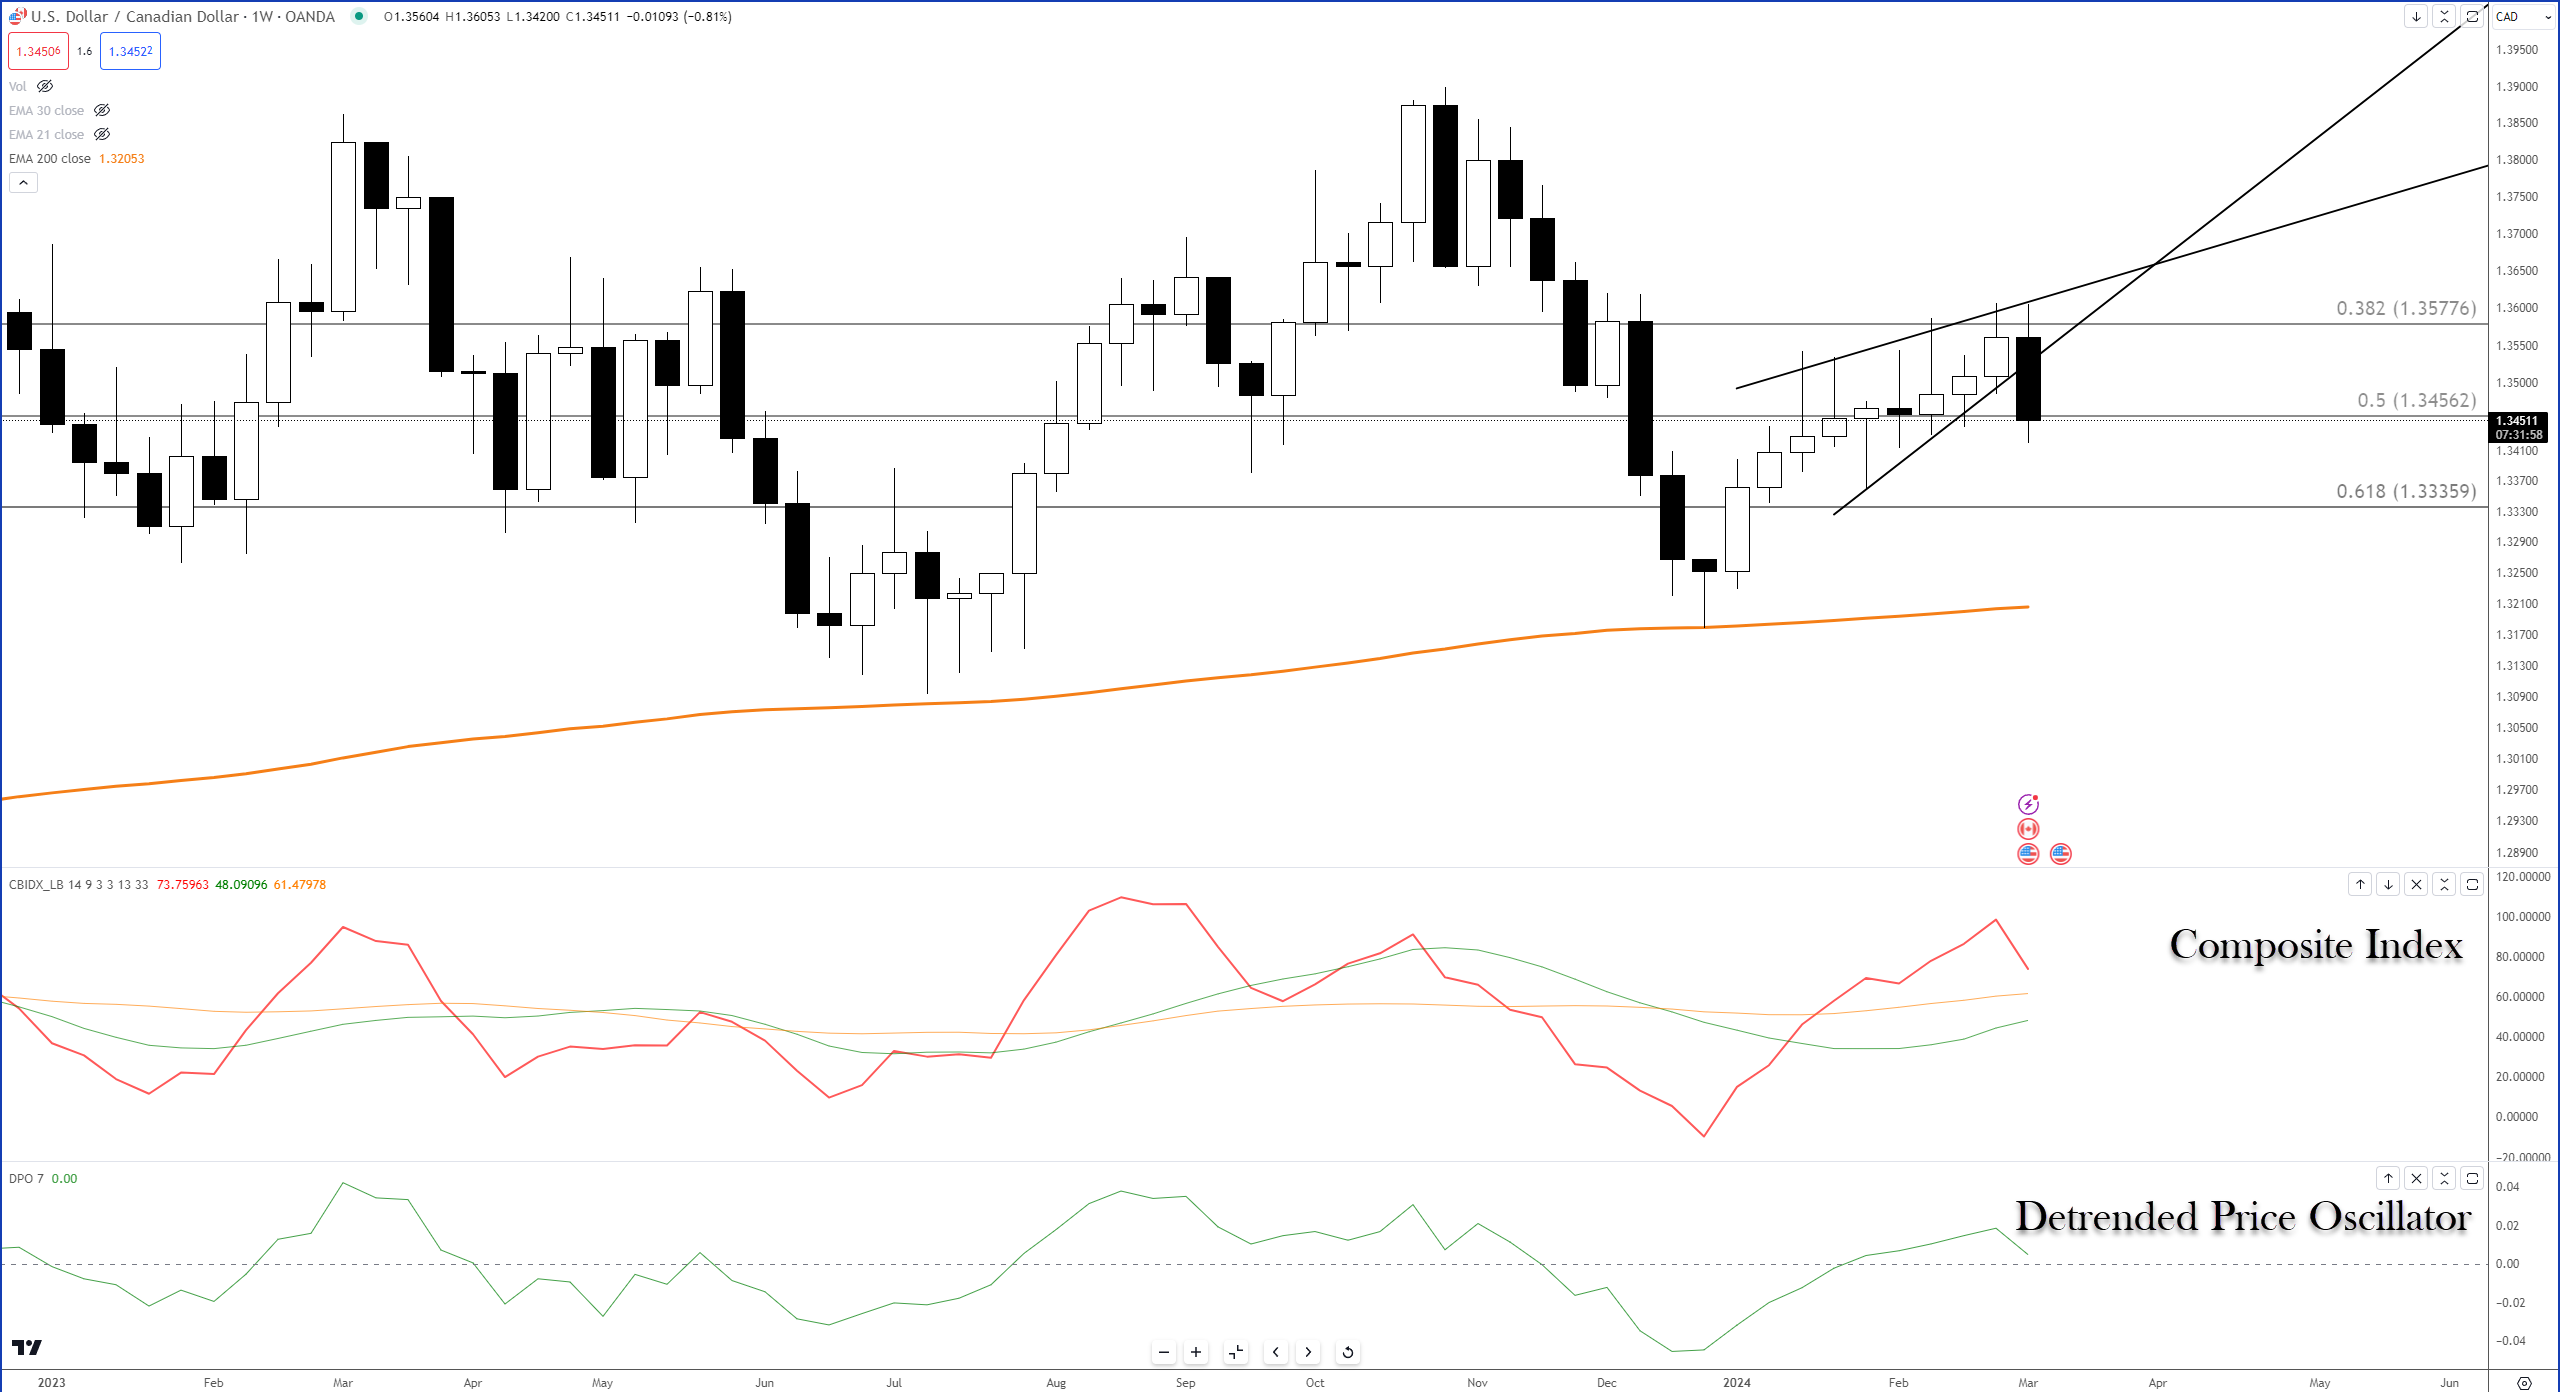
In addition, checking a longer timeframe chart is important to determine whether the daily chart could see any true movement lower. How does the weekly chart look? If you’re a bear, it looks awesome. The USD-CAD is below the 21-week moving average, and the oscillators are coming off of historical resistance levels.
The only support level that gives bulls any hope of a reprieve is the 50% Fibonacci retracement at $1.3456.