

With the advent of earnings season in April, it’s a good time for investors to juggle their portfolios. Which stocks to keep? Which to discard? Which to accumulate? Too many questions and no answers? Don’t worry! TipRanks has a simple answer to all your doubts.
TipRanks has created a Website Traffic Tool that extracts data on the number of unique visits plus total visits to a company’s website over a period of time. Through the tool, you can analyze what the visitor’s traffic to a publicly-traded company’s website indicates about the “stickiness” of the company’s products and services.
The TipRanks Website Traffic Tool helps you assess a company’s website traffic trends for the last month, quarter, or even over the last year. The data can be compared sequentially or year-over-year to see if the visitor traffic has increased or declined.
Moreover, the trend gives an added advantage in gauging the company’s performance well before its earnings results. An upward trend in the graph indicates that the total number of visits to the website has increased and therefore, a reasonably good quarterly performance can be expected, and the vice versa for a downward sloping graph.
Website Traffic Accuracy
The Website Traffic Tool sounds simple enough, but how successful has it been in helping investors in indicating a company’s quarterly performance? We’ve been tracking the fastest growing websites in the TipRanks universe with a focus on both Top Trending Websites and Websites Losing Traffic. In the past, we have helped investors to outsmart the market using the Website Traffic Tool.
Let us look at three case studies on the effectiveness of the tool.
Coinbase Global, Inc. (COIN)
Coinbase is a provider of end-to-end financial infrastructure and technology for the crypto-economy. The company generates the majority of its revenue from transaction fees from trades that occur on its platform.
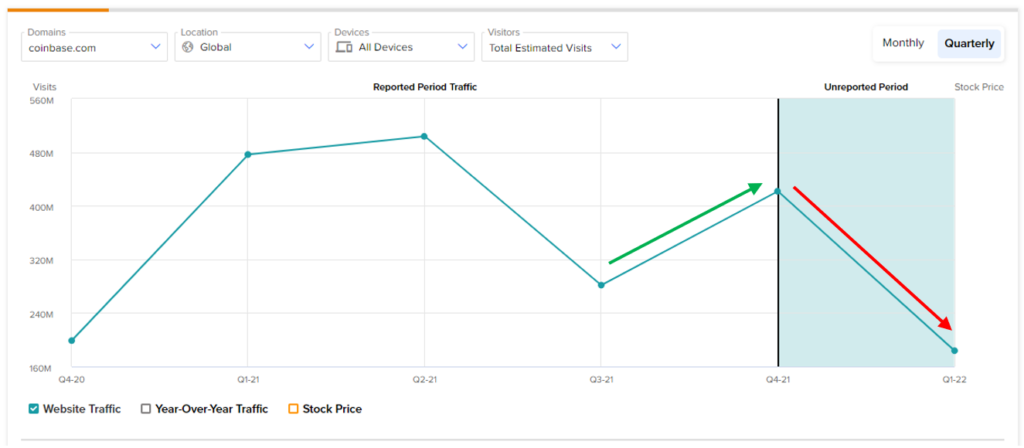
In Q4, COIN’s Website Traffic Tool indicated a 49.8% uptick in total visits, reflecting growth in its quarterly performance. What followed was a better-than-expected Q4 earnings and revenue beat for Coinbase. The company’s monthly transacting users (MTUs) leaped 54% sequentially to 11.4 million. Following the results, the COIN stock sank 1.5% the following day, but gained 7.9% the day after, and since has garnered upward momentum.
Notably, in the Q4FY21 shareholder report, the company guided for the unreported quarter based on the lower crypto asset prices coupled with lower crypto asset volatility witnessed year-to-date, and stated that “retail MTU and total Trading Volume will both be lower in Q1 2022 as compared to Q4 2021.”
A similar declining trend is visible in Coinbase’s website visits as per the Website Traffic tool, giving a fairly reasonable guide to the company’s performance well ahead of its earnings results.
Sofi Technologies, Inc. (SOFI)
Sofi Technologies is an online personal finance company providing student and auto loan refinancing, mortgages, personal loans, credit cards, investing, and banking through both mobile app and desktop interfaces.
Similar to Coinbase, SOFI’s Website Traffic Tool indicated major growth (20.17% sequential upside) in its fourth-quarter performance before its results announcement, and SOFI delivered an upbeat Q4 print. Following the results, SOFI stock opened the following day up 15.6% and ended the day gaining 3.4%.
Furthermore, Sofi has projected a softer Q1FY22 outlook due to the “unexpected extension of the federal student loan payment moratorium to May 1, 2022.,” as per its release. This is evident with the declining Q1 trend in website visits seen on the TipRanks tool, clearly unfolding the benefit of using the tool appropriately as a pre-indicator of earnings.

Robinhood Markets, Inc. (HOOD)
Robinhood is a modern financial services platform offering cryptocurrency trading, dividend reinvestment, fractional shares, recurring investments, and IPO Access. The company earns net revenues through transaction fees for each order executed.
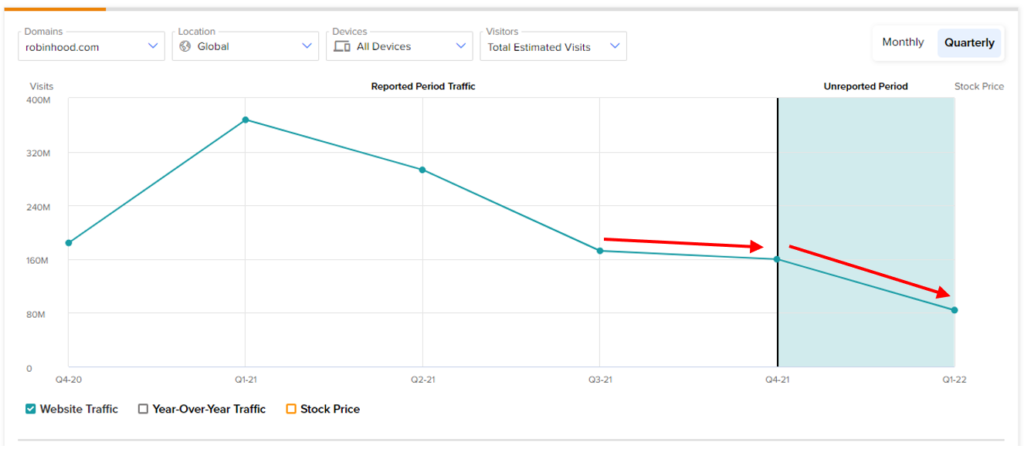
For the fourth quarter of fiscal 2021, HOOD’s Website Traffic Tool indicated both a sequential decline (7.2%) and a year-over-year fall (13.2%) in the total number of visits to Robinhood’s platform. This indicated that the company’s userbase was dimming in the quarter and that the company may not do as well as expected. Eventually, HOOD reported a decline in its Q4 monthly active users and missed analysts’ earnings consensus. Further deterioration is expected in the company’s performance in Q1 as per the tool’s data.
Following its Q4 results, HOOD plunged 12% during the after-hours trading session and further crashed over 15% during pre-market trading the following day.
As is visible in the above case studies, the TipRanks Website Traffic Tool has indicated the probable direction of a company’s performance and the stock’s price movement. The tool gives an insight well ahead of a company’s earnings and prepares investors beforehand for the probable outcome of the results. Investors can thereby make informed decisions on their holdings and accordingly park their investible corpus funds.
How Can I Use the Website Traffic Tool for Investing?
There are different ways in which the Website Traffic Tool can be used advantageously by investors.
Firstly, on TipRanks, you can browse through the fastest-growing websites to gauge which companies are trending or losing out of online visits. This can help you streamline the list of companies in which you may invest.
Secondly, you can individually study the website traffic trends of the companies in your portfolio to analyze their performance and make informed decisions about retaining/discarding/accumulating.
As with all TipRanks tools, TipRanks Website Traffic is simple to use and you can filter data according to your preferences.
As a cautionary note, the TipRanks Website Traffic analysis may be more meaningful for ecommerce portals, social media platforms, and financial companies which offer direct-to-consumer services through their websites and apps. The tool may be less indicative in sectors such as manufacturing and commodities where a website click may not necessarily convert to a successful client.
Fun Fact: A look at the Q1FY22 Website Traffic Tool data of many ecommerce portals reflects a declining trend in the number of visits, both compared sequentially (due to the robust holiday season last quarter) and also year-over-year (due to the pandemic-triggered elevated online shopping in the year-ago period). This, however, does not necessarily mean that they are bad investment choices. Yes, companies may perform poorly in the short term, but their long-term standing needs to be analyzed and an informed decision needs to be made.
In times of economic uncertainty, the ongoing Russian war on Ukraine, and a heightened inflationary environment, it becomes difficult to gauge consumer behavioral patterns.
At such times, with a combination of different TipRanks’ Tools, an understanding of the overall economic scenario, and individual risk appetite, you can devise the best investment strategies for your portfolio!
Download the TipRanks mobile app now
To find good ideas for stocks trading at attractive valuations, visit TipRanks’ Best Stocks to Buy, a newly launched tool that unites all of TipRanks’ equity insights.
Read full Disclaimer & Disclosure
