

Great news for investors, trading platforms and online brokers: After years of research revolving around stocks, with no analysts covering ETFs and no real tools to help investors make data-driven investment decisions, TipRanks has revolutionized the world of ETF research.
We are pleased to announce that we have added ETF research capability, covering 7,000 ETFs. We provide in-depth, unique datasets on ETFs that you won’t find anywhere else. Thanks to TipRanks, investors will find all the data they need to fully delve into ETFs they already hold or are considering buying.
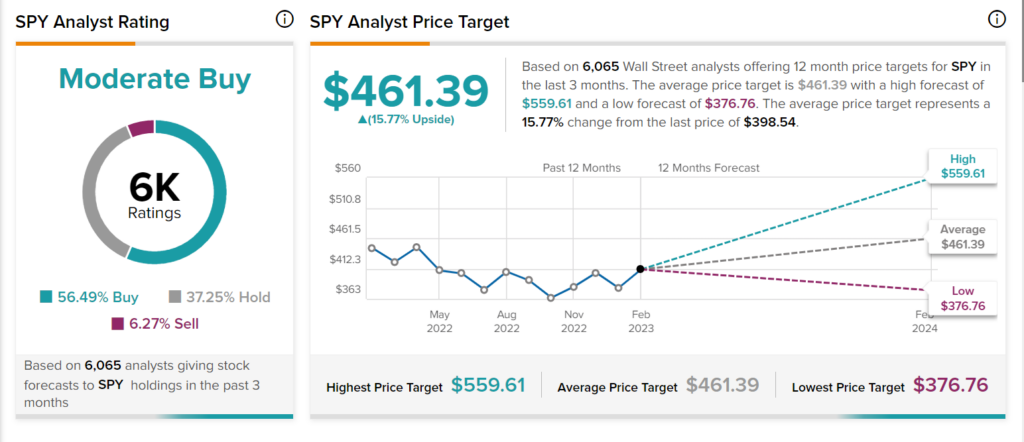
ETF Analyst Forecast and Price Targets
TipRanks is the first and only platform that provides an analyst forecast and price targets for ETFs. Our proprietary technology calculates them on the basis of all the underlying assets in the ETF. We figure out a weighted average of all the ETF’s holdings, and use that to calculate the average analyst consensus on the entire ETF. At a glance, you will see the overall analyst rating, analyst price target, and upside or downside on an ETF.
Here’s an example of the Analyst Forecast for the SPY ETF:
ETF Smart Score – Will the ETF Outperform?
As part of the offering, TipRanks also makes its award-winning Smart Score available for ETFs. The ETF Smart Score is based on the weighted average of the ETF holdings and some additional factors. With a score of 1 to 10, the Smart Score, based on six key factors, predicts whether the ETF is likely to outperform the markets. A Smart Score of one to three implies Underperform, while a score of four to six implies the ETF will perform inline with the general markets, and of seven to ten implies Outperform.
Take a look at our proven Smart Score to help determine the future performance of any ETF. Here’s an example of the Smart Score for the SPY ETF:

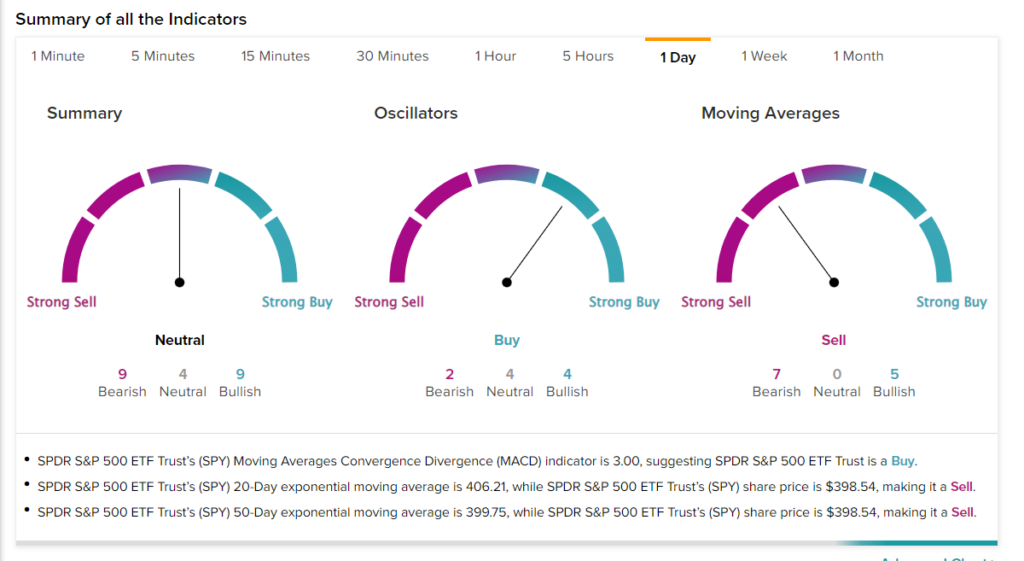
ETF Technical Analysis
Your ETF research on TipRanks doesn’t stop there. Indeed, our Technical Analysis page for ETFs gives you multiple measures to further understand the ETF’s trajectory. Not only do we display Classic and Fibonacci pivot points, but we also provide simple and exponential moving averages. We give you the moving averages for six different time periods, as well as a MACD indicator. Our summary of all indicators shows you sentiment on the basis of the indicators, telling you whether they point to a Buy or Sell on the ETF.
Our technical analysis page for each stock also shows a wealth of other values, including RSI, ADX and ROC. TipRanks also interprets each of the values, so investors will know which action they suggest taking on the ETF: Buy, Neutral or Sell.
Here’s an example of the Technical Analysis on the SPY ETF:
How Do I Use the ETF Holdings Pages on TipRanks?
Additionally, for each ETF, we provide a Holdings page, with a clear and easy-to-read presentation of the data. We display the holdings count, dollar value of total assets, asset class, category and region of North America. Here is an example from the SPY ETF Holdings page:
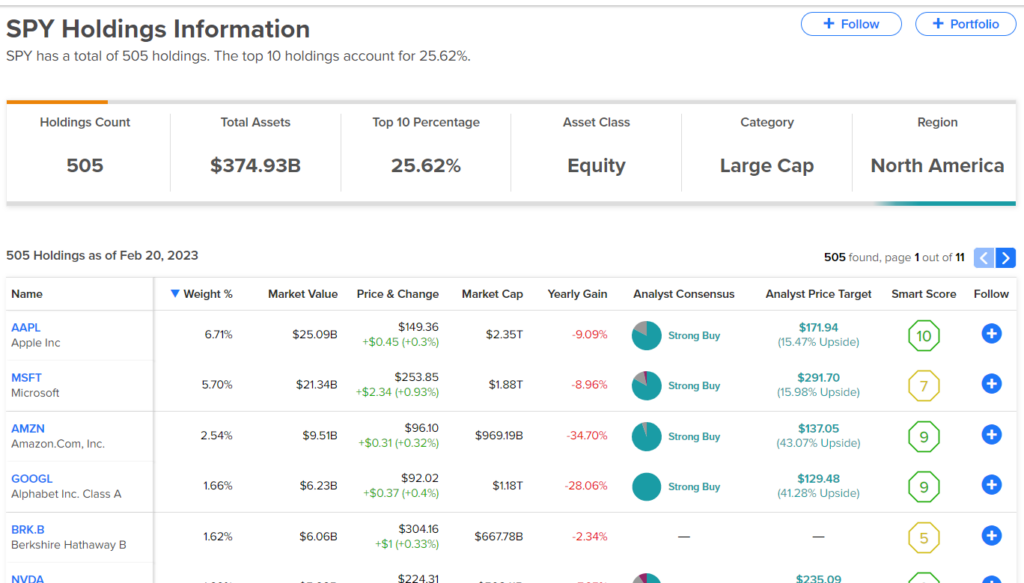
Our table then presents all the holdings of the ETF so you can easily research each and every holding. For each stock, we display the percentage of weight it carries in the ETF, market value, price, market cap, yearly gain, analyst consensus, analyst price target, and Smart Score. Click on any ticker to further research it.
Where Can I Find ETF Pages on TipRanks?
Navigate to TipRanks’ ETF page to begin your research. From the top menu, hover over Research Tools, and in the second column, you will see Top ETFs by AUM. Click there to see all the ETFs we cover on our site. Once you are on the List of ETFs page, click on an ETF ticker to learn more about its holdings, performance and other important information.
Join the millions of savvy investors who are transforming their ETF investment strategies. With TipRanks’ revolutionary ETF research capability, you can access exclusive, groundbreaking datasets, including analyst forecasts and price targets, our unique Smart Score, and technical analysis tools. Make confident, informed decisions and take your investment portfolio to the next level with TipRanks!
