

Whether you are one of the over half a million investors who use TipRanks’ Smart Portfolio to assess your holdings, or you’re new to the service, we’ve got exciting news for you!
Following feedback from thousands of users, the R&D team at TipRanks has spent the past year improving Smart Portfolio to ensure it is the smartest portfolio analysis tool in the world.
Even before the changes, users loved the platform with its cutting-edge analysis capabilities. Now, following user feedback, it offers more features and an improved interface to ensure the tool is the most insightful, powerful, and intuitive it can be.
We tested the updated Smart Portfolio on a small number of users and have spent the past month making improvements based on their feedback. Now all TipRanks users can benefit from the new features and design. We are delighted to introduce you to what’s new on Smart Portfolio 2.0.
OVERVIEW
The Overview now shows you how Bitcoin and Apple are performing, alongside gold and the major indexes.
As before, you can see an overview of your holdings, your daily top gainers and losers, how your portfolio returns compare to the S&P 500, the latest news about the stocks in your portfolio categorized according to All, Bullish, Bearish, and upcoming events such as earnings reports and ex-dividend dates.
HOLDINGS
Many of the improvements can be seen in the Holdings section. This is where you receive a full analysis of all the holdings in your portfolio. Due to popular demand, it now supports:
– Fractional shares
– ETFs
– Shares listed in the UK (with more markets to come)
– Pre-market prices, depending on the time of day
The Basic view continues to provide a basic overview of your holdings, including analyst consensus, average price target, and the much-requested Smart Score.
Go to the Customized View to customize fields according to different criteria and reorder the columns. Some of the criteria such as Smart Score, Top Analyst Consensus & Price Targets are reserved for Premium members. Ultimate users can now download data about their holdings to Excel.

Detailed View
You have access to more details about each holding, just click on the row to see more. You can now find more detailed metrics than before, such as different chart options, including a candlestick view for technical analysis, a section to add notes, the Smart Score, and its contributing market factors, as well as details about the company you have invested in.
The new Transactions tab shows you two ways to manage or view your transactions:
‘Reported by me’ gives you the flexibility to add and edit transactions manually, including date, type of transaction such, Buy or Sell, number of shares, and purchase price.
‘Recorded by TipRanks’ shows you your transactions as measured by TipRanks. Returns are based on the end-of-day price after you added a transaction. While you can update this data manually, or by synching from your trading platform, you cannot edit this data. Your portfolio performance ranking is based on your ‘Recorded by TipRanks’ transactions.

ANALYSIS
The Analysis section of the portfolio now offers deeper insights into your holdings with the addition of the Geo allocation of your holdings and your top-performing stocks.
You can now also see how your holdings are allocated according to the following parameters:
– Sector
– Market Cap
– Dividend
– Beta
– P/E Ratio

As previously, you also have data about your portfolio volatility, P/E, dividends, and risk warnings, with improved access to the most relevant stocks in each section. There is also a new section with more details about your dividend paying holdings.

PERFORMANCE
You can still see how your portfolio performance compares to other users’ portfolio performance. However, we’ve made this more sophisticated as there are now two ways to assess your performance.
– ‘Activity Recorded by TipRanks’ performance is based on the end-of-day stock price when you add a holding to your portfolio and cannot be edited. Your portfolio performance is ranked according to this objective measurement.
– ‘Activity Recorded by me’ is data that you can edit. This was requested by TipRanks users, and by creating two different performance models, you have the flexibility to edit your holdings, while we maintain an objective way to measure ranking.
In both cases, you can see how your portfolio performance compares to the average TipRanks portfolio, the top-performing portfolios, and the S&P 500 and change how the chart appears when comparing your portfolio returns to the S&P.

Make your portfolio public to share your successes with other investors!
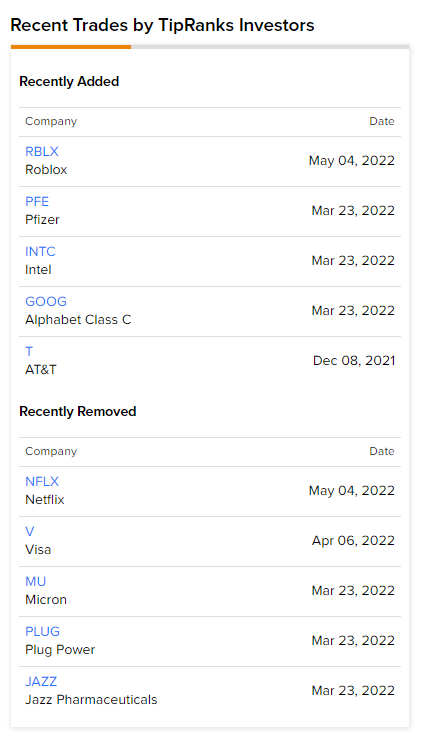
CROWD INSIGHTS
Crowd Insights is where you can see how your portfolio compares to other investors’ portfolios, and if you have a Premium account, you can compare your portfolio to the top-performing portfolios.
There’s an exciting new feature here which shows you the recent trades of TipRanks investors.
PORTFOLIO NEWS
This new feature of Smart Portfolio 2.0 presents more news stories than are available in Overview, while maintaining the simple interface so that you can easily recognize which stock is being written about and you can focus on all, Bullish, or Bearish news.
This feature also separates TipRanks News & Analysis about the stocks in your portfolio.
CALENDAR
The calendar is another new feature and enables you to easily see upcoming earnings reports and ex-dividend dates for the stocks in your portfolio.
WHAT’S NEXT
We have more improvements in the pipeline, including adding more markets and cryptocurrencies to the platform.
In the meantime, we would like to thank the following
–Users who shared their requests for Smart Portfolio, your feedback has been invaluable
– Users who tested Smart Portfolio 2.0 and told us what we got wrong so that we could fix it and what we got right, so we knew not to touch it
– The R&D team, who worked so hard behind the scenes to make this happen. A special thank you to Gilad (CTO), Ofir (project manager), Robbie (head of product), Aizik (full stack developer), Nir (R&D Manager), Chen (product designer), Keren (head of design), Tamir (Backend team lead), Ada (QA team lead).
TELL US WHAT YOU THINK!
We invite you to head over to Smart Portfolio 2.0 and give it a spin! Let us know how you get on and please send us your ideas for improvement. Please feel welcome to contact us through our social channels or by emailing our Support team.
Twitter | Instagram | Facebook | TikTok | LinkedIn | Support
