


Using TipRanks’ data, you can be a do-it-yourself investor and build your own deep-value-focused ETF for maximum potential returns. Granted, it won’t be as diversified as a fund with 100 or 500 stocks, but turning $10,000 into $100,000 can now become a more realistic objective. Plus, you won’t have to pay any ETF management fees since you’ll effectively be the fund manager – a title you can brag to your friends about while you collect dividends and enjoy the long-term share-price appreciation of undervalued businesses.
Pick the best stocks and maximize your portfolio:
- Discover top-rated stocks from highly ranked analysts with Analyst Top Stocks!
- Easily identify outperforming stocks and invest smarter with Top Smart Score Stocks
Exchange-traded funds, or ETFs, are a fast and convenient way to own a group of stocks with something in common. There’s nothing inherently wrong with taking $10,000 and investing it in existing ETFs, though there are disadvantages – and quite possibly, a better way.
For one thing, you’re not likely to get 10x-in-a-decade potential with most ETFs. They’re highly diversified for a reason: Each stock will typically have a small weighting in the fund so that if one company has problems, it won’t weigh down the entire fund too much.
In other words, putting $10,000 into traditional ETFs will probably let you sleep soundly at night, but there’s an opportunity cost because you can’t control what’s in the fund, and therefore, you can’t go value hunting and pick a handful of huge winners. Instead, using TipRanks’ data to build your own ETF instead can solve those problems.
Deep Value Portfolio: Build it Up with Beaten-Down Stocks
A great place to start building your $10,000 self-directed portfolio is TipRanks’ stock screener. Here’s an example of how I built my own ETF in October 2022.
To start, I filtered for medium-, large-, and mega-cap stocks. Then, I specified that I wanted only companies that paid high annualized dividend yields (above 2.5%).
Then, I did something that most people would never do: I filtered for stocks with neutral, negative, or very negative investor sentiment. This might sound like a ridiculous thing to do, but remember: We’re looking for beaten-down value stocks that most investors don’t like right now. It’s not psychologically easy to be a contrarian, but it’s a strategy that worked out quite well for the likes of Warren Buffett and Charlie Munger.
With those filters – and I encourage you to build your own $10,000 value portfolio by trying out TipRanks’ stock screener – I managed to narrow down the vast sea of stocks to around 200 of them. I saw some highly familiar names in there, and I chose to gravitate toward the more famous companies since they tend to offer a layer of safety and comfort that unfamiliar names don’t.
I suggest that you do the same: Stick to names you know before venturing into unfamiliar territory. After all, famous companies typically have deeper capital reserves and consumer loyalty due to their brand-name recognition.
An Old Valuation Metric That Never Really Goes Out of Style
If you’re in the Millennial or Generation Z age demographics, you probably don’t want to do things like your parents and grandparents did them. That’s a natural impulse, as we all seek to form our own unique identities in our youth. Yet, I invite you to consider using a valuation metric that served previous generations of investors quite well: the good old price-to-earnings or P/E ratio.
Even today, the P/E ratio serves as a rough-and-dirty but nonetheless effective measure of whether a stock’s price is justified by the corresponding company’s earnings/profits. For the purposes of this discussion, I’ll be using the trailing 12-month P/E ratio, which is a valuation measure that spans the past year.
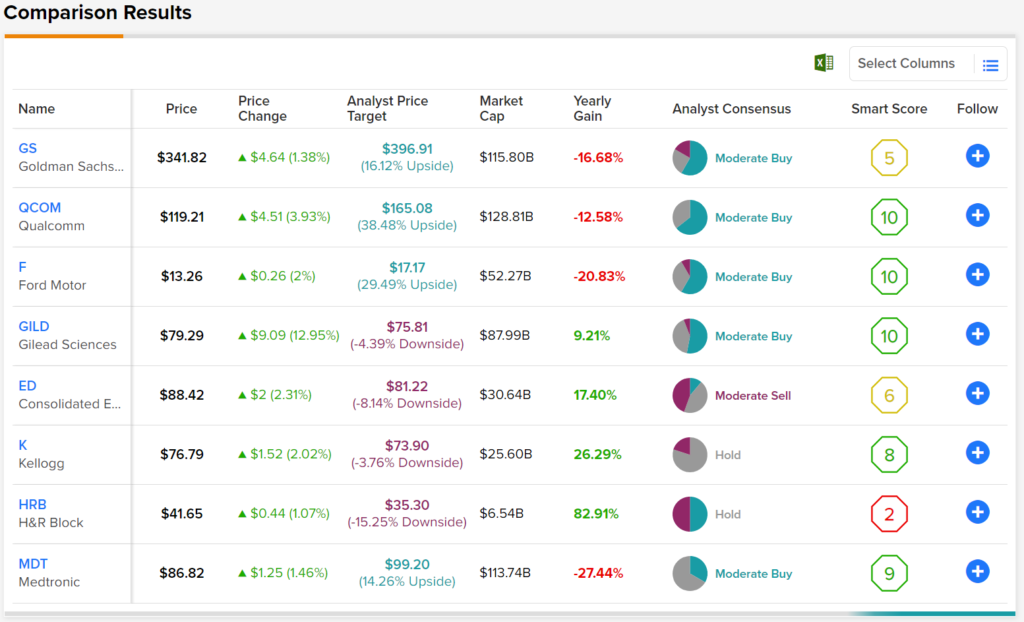
So, back to the screener. One familiar name that met all of my criteria is Goldman Sachs (GS). Hold on, though – one share of Goldman Sachs costs $325. That sounds pretty expensive, doesn’t it?
Let’s check the P/E ratio, which is found on each stock’s Stock Analysis page, to see if Goldman Sachs stock is actually expensive in relation to the company’s earnings, though. As it turns out, Goldman Sachs’ P/E ratio is 8.65x, which is quite reasonable. Typically, anything under 25x is pretty good, and when you start getting below 10x, you’re in deep-value territory (assuming the company isn’t on its way to bankruptcy, which Goldman Sachs certainly is not).
Build Your List and Stick to It
As an added bonus, Goldman Sachs pays a forward annual dividend yield of 3.08%. Now we’re really cooking, so let’s see what other possible 10x winners the TipRanks stock screener generated.
I spotted Qualcomm (QCOM) among the results, and that company pays a 2.68% dividend while its P/E ratio is 10.26x – another great pick. Plus, we’re already starting to diversify since we already have a financial corporation and a technology business in our do-it-yourself value ETF.
Again, the idea is to build your own fund and not copy what anyone else is doing. Still, I don’t mind sharing some of the other results I found in October 2022, which check all of the boxes. These include:
- Ford (F) (P/E ratio of 4.22x, dividend yield of 4.92%)
- Gilead Sciences (GILD) (20.73x, 4.31%)
- Consolidated Edison (ED) (18.61x, 3.79%)
- Kellogg (K) (16.65x, 3.27%),
- H&R Block (HRB) (12.43x, 2.86%),
- Medtronic (MDT) (21.51x, 3.3%)
That’s just a sample – the rest is up to you. By combining deep value with generous dividend yields, you stand a decent chance of outperforming many fee-bearing funds. Heck, given enough time and patience, you might even take that five-figure account and eventually add a zero at the end.