

In this piece, we used TipRanks’ Comparison Tool to evaluate two publicly traded investing platforms. As you will see, Interactive Brokers (IBKR) is the better choice when compared to Robinhood (HOOD).

It’s no secret that the COVID-19 pandemic inspired more individuals to trade stocks than ever before, and stock trading platforms benefited dramatically. Publicly traded names saw their stocks soar as they added more and more users, although some clearly benefited more than others due to other factors in the sudden hype in investing among retail investors.
However, things have changed significantly since the trading boom driven by the pandemic. Stock prices have been heading steadily lower since November and December 2021. The S&P 500 peaked at around 4,766 in December, while the Nasdaq Composite peaked at around 16,057 in November.
As a result, retail investors just aren’t as interested in trading as they were when the latest bull run was in force. However, investors will notice that those other factors that drove differences in the levels of benefits enjoyed by various trading platforms continue to affect their user counts and stock prices.
Analysis reveals that those stock trading trends that drove activity on various stock trading platforms remain in force, suggesting that a bullish view may be appropriate for Interactive Brokers while calling for a neutral-to-bearish view on Robinhood.
Stock Trading Trends
According to Deloitte, about 6 million Americans downloaded a retail stock trading app in January 2021 alone, but by then, the pandemic-era trend was already in full swing. More than 10 million Americans opened a new brokerage account in 2020.
Many people around the world found themselves suddenly out of work when the pandemic hit. As a result, many Americans turned to the stock market when they found themselves with a lot of free time and no money coming in. Additionally, the U.S. government handed out sizable piles of free money, lining consumers’ pockets with thousands of dollars that they could put to work in the stock market.
FOMO also swept the stock markets during the pandemic as consumers watched stock prices soar and started to fear they were missing out. Social media also started to play an important role in trading during the pandemic as retail investors discussed various stocks and, in the case of forums like Reddit’s WallStreetBets, sent some stocks through the roof with no fundamental basis in reality.
Deloitte categorized the new flood of retail investors into two buckets. The first includes young, novice investors with little to no experience who are sometimes heavily influenced by what they read on social media and from other sources of information. The second bucket contains savvier investors with more experience and more money available to invest. Social media can impact this group, but perhaps not as strong as the first group.
Robinhood Stock
One of Robinhood’s problems is which bucket of retail investors tend to use its platform. It originally attracted users by offering “free” trades, so it attracted investors who didn’t have much money. The average Robinhood user is a 31-year-old man with $240 in his account, and about half of its customers are first-time investors. On the other hand, the average Charles Schwab user is 50 and thus tends to have more disposable income.
In 2021, the average user had $4,000 in their Robinhood account, compared to $127,000 for the average E-Trade (MS) user and $234,000 for the average Charles Schwab (SCHW) user. The company reported in its second-quarter earnings release that its assets under custody had declined more than 30% quarter-over-quarter due mostly to lower market valuations, so it’s clear that Robinhood users are losing money. Meanwhile, Charles Schwab’s assets fell 10% year-over-year in its second quarter.
Robinhood’s other primary problem is its lack of profitability. Robinhood posted losses of -$0.34 per share for the second quarter, which missed the consensus of -$0.32 per share in losses. It also has a history of earnings and revenue misses.
As recession fears spread, investors are no longer willing to invest in unprofitable companies, so the stocks of unprofitable companies have plunged even more than those of profitable firms, regardless of sector. Rising interest rates will make it difficult for money-losing companies to keep their doors open because of how expensive it’s getting to borrow money.
As stock prices fall, this isn’t a particularly good time to invest in stock trading platforms except to buy and hold until brighter days, but Robinhood doesn’t even look like a great pick for that. The company lost almost 2 million users between the first and second quarters and more than 6 million over the last year. Additionally, Robinhood’s total unique visitors are down 49% year-to-date.
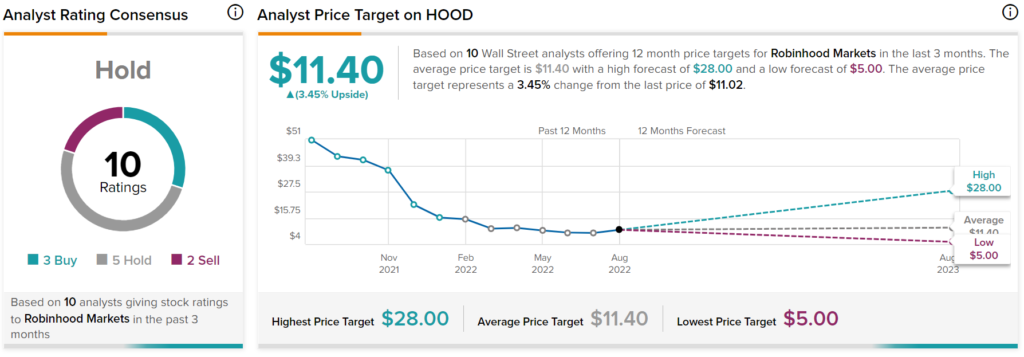
Robinhood has a Hold consensus rating based on three Buys, five Holds, and two Sells assigned over the last three months. At $11.40, the average Robinhood price target implies upside potential of 3.5%.
Interactive Brokers Stock
On the other hand, Interactive Brokers is holding up far better than Robinhood, potentially offering a buy-the-dip opportunity for those who want to buy and hold until the markets turn around. The average Interactive Brokers user is 42, with an average account size of $223,000, so the platform’s users are more well-established than Robinhood’s.
Unfortunately, Interactive Brokers has also been missing earnings and revenue estimates, but the most important factor here is that the company is profitable. Although both financial metrics are down year-over-year, the trading platform remains profitable, making it a better option at a time when investors are shunning speculative, cash-burning companies like Robinhood.
Interactive Brokers is also holding up better on other metrics. For example, the number of total unique visits to its website on all devices is down only 10% year-over-year, demonstrating better-staying power. The company also added 2 million client accounts during the second quarter, a 34% year-over-year increase and a 1% month-over-month increase.
These positive factors have led analysts to rate Interactive Brokers as a Strong Buy based on three Buy ratings assigned over the last three months. At $92, the average Interactive Brokers price target implies upside potential of 40.4%.

Conclusion: Interactive Brokers Stock is Significantly Better than Robinhood Stock
A look at the P/E ratios of the analyzed companies is very telling, as Robinhood’s stands at around -4x, compared to Interactive Brokers’ P/E of about 23x. This essentially means that Robinhood investors are losing $0.25 per dollar invested in the company. Conversely, Interactive Brokers investors earn roughly $0.043 per dollar invested, making it significantly better, especially in the current market environment.
It appears that Robinhood remains a story stock that may only be popular among the younger, inexperienced investors who typically frequent its platform. Robinhood’s earnings can’t improve until its users’ bank accounts improve, which could take longer than the accounts of those who frequent Interactive Brokers.
