


The NASDAQ (NDX) has had a great year, and the Invesco QQQ Trust (NASDAQ:QQQ), the ETF that invests in the NASDAQ 100, is up a scorching 55.3% year to date.
Elevate Your Investing Strategy:
- Take advantage of TipRanks Premium at 55% off! Unlock powerful investing tools, advanced data, and expert analyst insights to help you invest with confidence.
Much has been made of QQQ’s strong performance, but did you know another technology index ETF has surpassed its strong 2023 performance?
While it’s not as widely covered, the ETF representing the technology sector of the NYSE, the SPDR NYSE Technology ETF (NYSEARCA:XNTK), is up an even more scintillating 70.9% year to date.
Which of these two high-flying tech ETFs is worthy of a spot in investor portfolios going forward? The popular QQQ or the under-the-radar XNTK? Let’s find out.
What is the QQQ ETF’s Strategy?
QQQ tracks the Nasdaq-100 Index, giving investors “access to the performance of the 100 largest non-financial companies listed on the Nasdaq.”
The widely held ETF launched in 1999 and is now one of the largest ETFs in the stock market with $228.9 billion in assets under management (AUM).
QQQ is rebalanced quarterly and reconstituted annually.
What is the XNTK ETF’s Strategy?
XNTK “seeks to provide investment results that, before fees and expenses, correspond generally to the total return performance of the NYSE Technology Index, an “index composed of 35 leading US-listed technology-related companies.”
This index includes companies in the Information Technology sector and technology-related stocks from the Consumer discretionary sector.
Unlike many other ETFs, XNTK is equal-weighted at its annual rebalance. This is why it isn’t dominated by a handful of mega-cap tech stocks like many other popular tech ETFs, as discussed below.
XNTK launched in 2000, and is much smaller than the more heralded QQQ, with just $652.2 million in AUM.
Portfolio Comparison
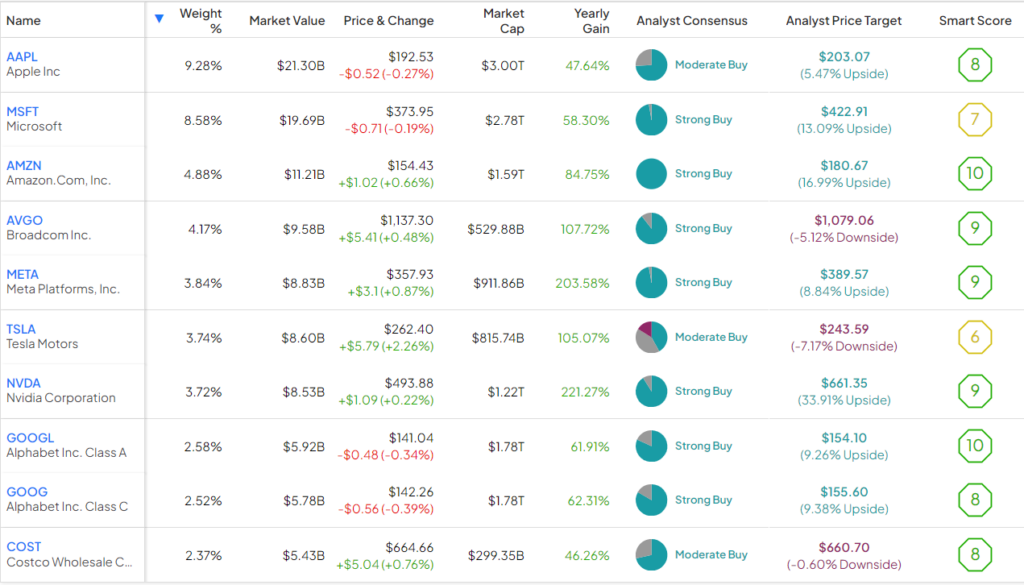
QQQ owns 101 stocks; its top 10 holdings comprise 45.7% of the fund.
Below is an overview of QQQ’s top 10 holdings using TipRanks’ holdings tool.
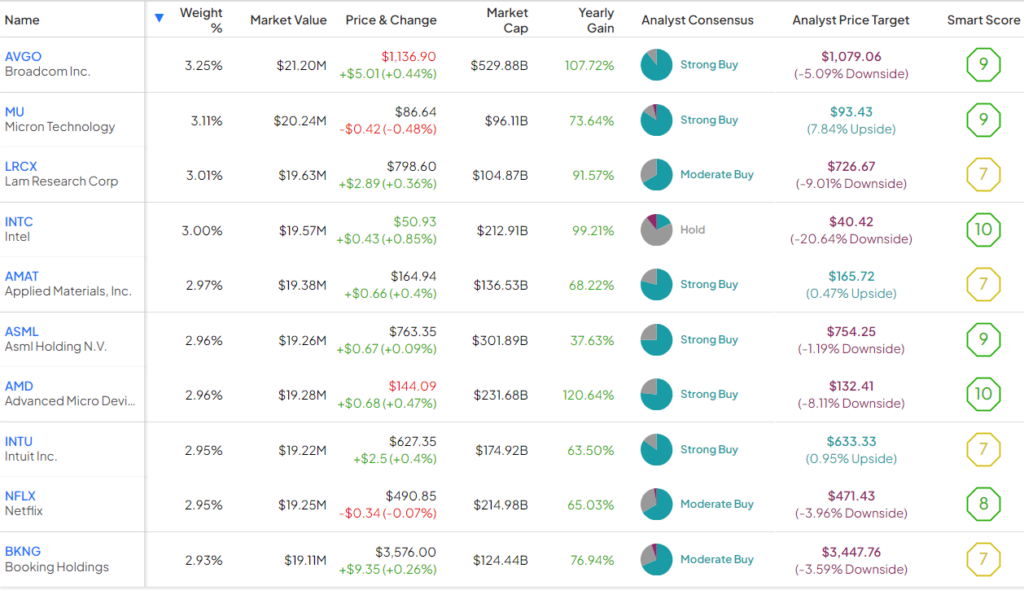
On the other hand, XNTK owns just 37 stocks, but its top 10 stocks comprise a lower percentage of assets than QQQ’s at 30.1%.
Below is an overview of XNTK’s top 10 holdings using TipRanks’ holdings tool.
As you can see, QQQ maintains prominent positions in mega-cap tech stocks like Apple (NASDAQ:AAPL) and Microsoft (NASDAQ:MSFT) and other members of the magnificent seven, such as Amazon (NASDAQ:AMZN), Meta Platforms (NASDAQ:META), Tesla (NASDAQ:TSLA), Nvidia (NASDAQ:NVDA), and Alphabet (NASDAQ:GOOG) (NASDAQ:GOOGL).
XNTK owns some of these top tech stocks as well but in lower concentrations. For example, Apple and Microsoft comprise 17.9% of QQQ’s portfolio but just 5.4% of XNTK’s.
XNTK’s top holdings are dominated by semiconductor companies like its top holding, Broadcom (NASDAQ:AVGO), plus Micron (NASDAQ:MU), Lam Research (NASDAQ:LRCX), Intel (NASDAQ:INTC), Applied Materials (NASDAQ:AMAT), and others.
However, XNTK isn’t limited to semiconductor stocks; it also owns stocks like Uber (NYSE:UBER), Netflix (NASDAQ:NFLX), and Booking Holdings (NASDAQ:BKNG). It also gives investors exposure to some of China’s biggest tech stocks like Alibaba (NYSE:BABA) and PDD Holdings (NASDAQ:PDD), plus Argentina’s MercadoLibre (NASDAQ:MELI).
TipRanks’ Smart Score system is a fan of both portfolios. The Smart Score is a proprietary quantitative stock scoring system created by TipRanks. It gives stocks a score from 1 to 10 based on eight key market factors. A score of 8 or above is equivalent to an Outperform rating. Seven of QQQ’s top 10 holdings feature Outperform-equivalent Smart Scores of 8 or above, and XNTK features the same ratio.
Smart Score gives QQQ an Outperform-equivalent ETF Smart Score of 8, which is matched by XNTK’s ETF Smart Score of 8.
In conclusion, while the portfolios look slightly different, Smart Score rates both highly. Both are chock full of innovative companies that have recently driven the market higher, and both give investors plenty of exposure to long-term growth themes.
Head-to-Head Performance
Both ETFs have been phenomenal performers in 2023, and both have been strong performers over the long term.
As of November 30th, QQQ has returned 9.7% on an annualized basis over the past three years. It has returned an excellent 18.9% over the past five years, and 17.4% over the past decade.
Over the same time frame, XNTK has underperformed QQQ over the past three years with an annualized return of 5.8%, but it has slightly outperformed it over the past five years with an annualized return of 19.3%. Over the past 10 years, it has matched QQQ with an identical 17.4% return.
Ultimately, both of these ETFs have been excellent performers, and while they took different routes to get there, they generated identical 17.4% annualized returns over the past 10 years.
Comparison of Fees
Another area that investors should compare ETFs on is the fees that they charge. In this case, QQQ is a bit cheaper than XNTK. QQQ charges an expense ratio of 0.20%, while XNTK charges 0.35%.
This means that an investor will pay $20 annually on a $10,000 investment in QQQ, versus $35 on a $10,000 investment in XNTK.
The difference in these expense ratios becomes more apparent over time. Assuming that both ETFs return 5% per year going forward and maintain their current expense ratios, after 10 years, the investor who put $10,000 into QQQ would pay $255 in fees while the investor who put $10,000 into XLK would pay $443.
Is QQQ Stock a Buy, According to Analysts?
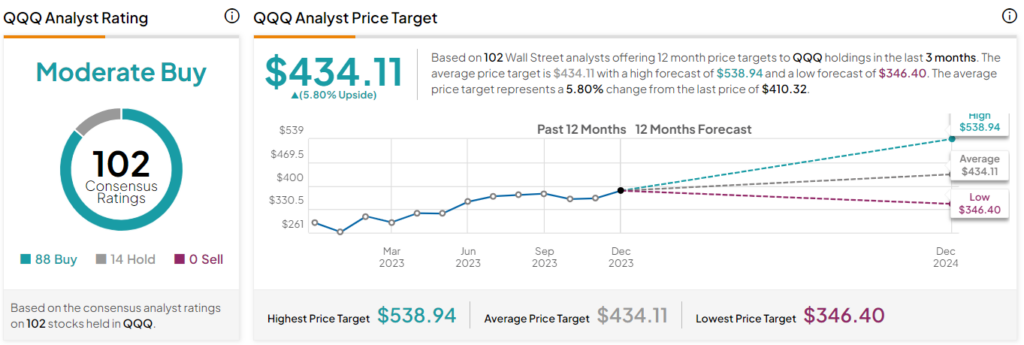
Turning to Wall Street, QQQ earns a Moderate Buy consensus rating based on 88 Buys, 14 Holds, and zero Sell ratings assigned in the past three months. The average QQQ stock price target of $434.11 implies 5.8% upside potential.
Is XNTK Stock a Buy, According to Analysts?
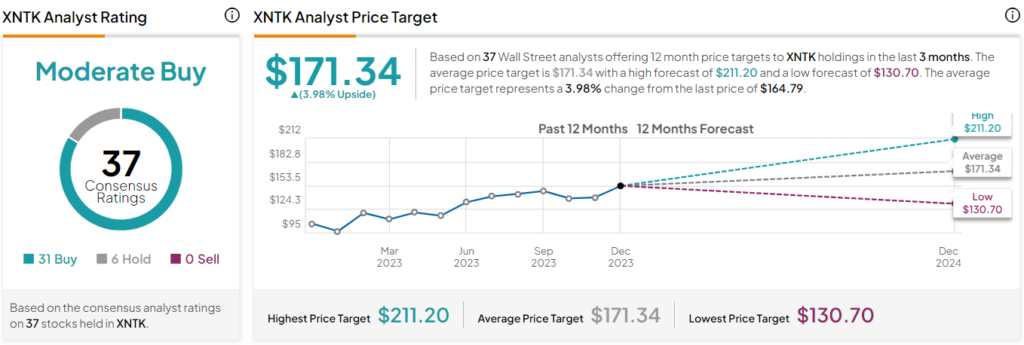
Turning to Wall Street, XNTK earns a Moderate Buy consensus rating based on 31 Buys, six Holds, and zero Sell ratings assigned in the past three months. The average XNTK stock price target of $171.34 implies 4.0% upside potential.
Which Tech ETF Belongs in Investors’ Portfolios?
These tech ETFs both feature strong and highly-rated portfolios of many of the world’s top tech companies. Both have been strong performers that have generated excellent returns for their investors over the past decade. The critical difference is that QQQ is cheaper than XNTK, although both feature reasonable expense ratios in the big picture.
In reality, these are both great tech ETFs, and while QQQ has a slight edge here based on its lower expense ratio, investors would do well to own both. Owning QQQ gives investors exposure to the NASDAQ 100 with a heavy dose of the magnificent seven. XNTK offers investors a similar theme, but with a different flavor and more exposure to semiconductors and stocks like Uber, Alibaba and Shopify (NYSE:SHOP) that you won’t find in QQQ.
XNTK owns fewer stocks but is simultaneously less concentrated than QQQ. Ultimately, I think there is room for investors to own both of these top tech ETFs in their portfolios.
XNTK owns fewer stocks, but it is also simultaneously less concentrated than QQQ. Ultimately, I think there is room for investors to own both of these top tech ETFs in their portfolios.