

Lululemon Athletica (LULU) is a sports apparel company specializing in clothes designed for a healthy lifestyle and athletic activities, such as yoga, running, and training, and various sweaty recreations. Despite Lululemon’s branding itself for such niche activities, the company has gathered international appeal. With sales and profitability expanding rapidly, Lululemon currently features a market cap of around $52.6 billion.
While COVID-19 limited relevant businesses such as gyms, consumers’ increased interest in outdoor sports and activities following global lockdowns actually boosted demand for Lululemon’s products. I am bullish on the stock. (See Lululemon stock charts on TipRanks)
Brand Value Boosting Margins
Lululemon’s sales growth momentum following the pandemic’s boost has hardly faded out. In its Q2 results, the company reported net revenue growth of 88% to $1.2 billion. International sales, in fact, grew by 125%, which means that the company should be less reliant on U.S.-based sales in the future, as the sales mix widens.
What makes Lululemon different and quite investor-friendly, compared to its larger peers, is not just its higher growth rates but sky-high margins. The company has managed to achieve excellent profitability levels in the sports apparel industry, due to its branding as a purveyor of luxury-like clothing that targets higher-end consumers, who are willing to pay a premium price.
For example, Lululemon’s women’s leggings, its flagship product, start selling at $69.00 post-discount, with an average price point above $100. For this reason, Lululemon’s gross margins are considerably juicier compared to the company’s competitors.
For context, Nike (NKE) and Adidas (ADDYY) feature gross margins of around 45% and 50%, respectively. This compares to gross margins of 57% in the case of Lululemon, despite the company’s significantly inferior scale and production capacities against these two industry behemoths.
Lululemon’s Valuation
These days, high growth, lucrative margins, and expanding brands do not come cheap. With Lululemon combining multiple such traits, its stock has consistently attracted a premium price tag, much like its products. Despite the growing profits attempting to catch up to the stock’s extensive rally and justify its valuation multiple, Lululemon trades at a forward P/E of around 47.
On the one hand, this is quite a high multiple for the company, industry-wise. On the other hand, with analysts expecting annual EPS growth of at least 20% over the next few years, it’s no wonder why investors keep buying any dip (which rarely occurs, anyway).
Wall Street’s Take
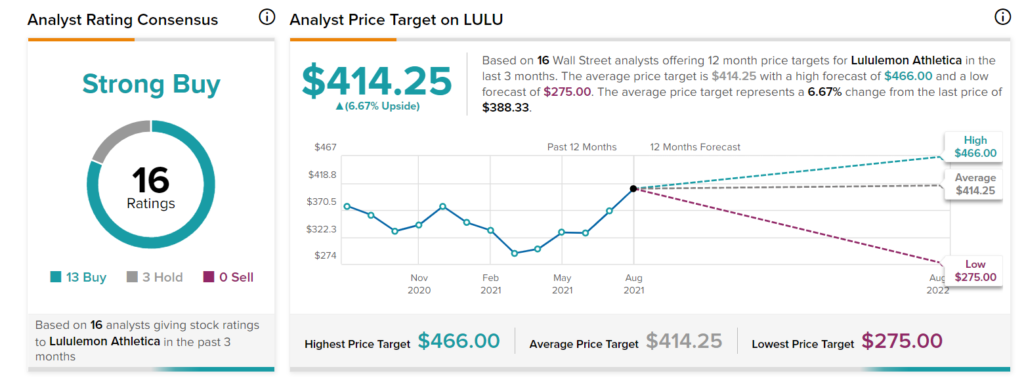
Turning to Wall Street, Lululemon Athletica has a Strong Buy consensus rating, based on 13 Buys, 3 Holds, and zero Sells assigned in the past three months. At $414.25, the average analyst LULU price target implies a 6.67% upside potential.
Moving Forward
Overall, Lululemon seems well-positioned to keep capitalizing on the growing demand for sportswear, especially on the ever-expanding wellness trend. The company keeps opening new stores, specifically two new stores in Q2, reaching 523 locations at the end of the quarter. At the same time, online sales gaining a higher percentage of the total sales mix should keep boosting net margins higher.
Shares may be pricey, but considering Lululemon’s growth trajectory and historically excellent brand-developing execution, investors may want to consider its long-term potential.
Disclosure: At the time of publication, Nikolaos Sismanis did not have a position in any of the securities mentioned in this article.
Disclaimer: The information contained in this article represents the views and opinion of the writer only, and not the views or opinion of Tipranks or its affiliates, and should be considered for informational purposes only. Tipranks makes no warranties about the completeness, accuracy or reliability of such information. Nothing in this article should be taken as a recommendation or solicitation to purchase or sell securities. Nothing in the article constitutes legal, professional, investment and/or financial advice and/or takes into account the specific needs and/or requirements of an individual, nor does any information in the article constitute a comprehensive or complete statement of the matters or subject discussed therein. Tipranks and its affiliates disclaim all liability or responsibility with respect to the content of the article, and any action taken upon the information in the article is at your own and sole risk. The link to this article does not constitute an endorsement or recommendation by Tipranks or its affiliates. Past performance is not indicative of future results, prices or performance.
