

While some high-yield dividend ETFs offer massive yields that entice investors, their returns can be underwhelming over time. Investors may receive a large dividend payout from these ETFs, but the price of the ETF is going down over time, offsetting the benefit of the dividend payments. Furthermore, some high-yield ETFs are comprised of low-quality dividend stocks that have high yields for a reason — they are underperforming stocks with falling share prices, and the market expects a dividend cut.
Instead of looking solely at dividend yield, it’s probably better to look for a combination of yield, a strong track record of long-term performance, and a portfolio of high-quality holdings. Enter the iShares Core High Dividend ETF (NYSEARCA:HDV) from BlackRock’s (NYSE:BLK) iShares, which offers a nice mix of performance and yield. Let’s take a closer look at this $10.5 billion ETF.
HDV’s Dividend
The iShares Core High Dividend ETF currently yields 4%. While this may not sound as attractive as some of the double-digit yields you will see from some high-yield ETFs, it’s still more than double the average yield of the S&P 500 (SPX). Furthermore, when you take HDV’s overall performance into account, the picture is more compelling.
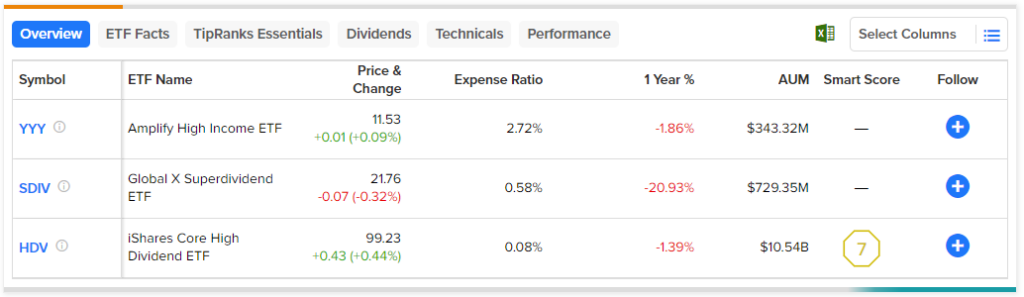
For example, take a high-yield ETF like the Amplify High Income ETF (NYSEARCA:YYY), which yields 12.4%, or the Global X Super Dividend ETF (NYSEARCA:SDIV), which yields 14.5%.
These yields sound a lot more tempting than HDV’s 4%, but when taking total return into account (as of March 31), HDV easily trumps these two higher-yielding vehicles.
Over the past three years, HDV has given investors an annualized total return of 16.9%. Meanwhile, even with their double-digit dividend yields, YYY and SDIV pale in comparison, with annualized returns of 7.5% and 3.3%, respectively, over the same time frame, meaning investors were much better off owning HDV.
HDV also wins out over a five-year time horizon, with an annualized total return of 7.8% versus 0.7% and -10% for YYY and SDV, respectively. Expand to the past decade and you’ll get largely the same result — an annualized total return of 8.4% for HDV versus 1.9% for YYY and -3.1% for SDIV.
Not to pick on these two ETFs, as there are many other examples, but HDV has beaten these higher-yielding ETFs and generated higher total returns by holding a portfolio of higher-quality dividend stocks that have simultaneously appreciated in price while paying high dividends.
Check out the chart below made using TipRanks’ ETF Comparison Tool, which allows investors to easily compare ETFs on performance and a variety of other key criteria.
HDV’s High-Quality Portfolio
HDV looks to invest in “established, high-quality U.S. companies,” according to iShares. It holds 76 U.S. stocks that “have been screened for financial health,” so you aren’t getting a portfolio of falling knives with dividends that run a high risk of being cut.
Essentially, HDV ETF screens for “high quality” companies by using Morningstar’s Economic Moat index and for financial health by using Morningstar’s “Distance to Default” metric, which measures a company’s likelihood of default. You can think of an economic moat as a sustainable competitive advantage that protects a business from encroachment by competitors. Companies with wide moats operate in industries with high barriers to entry that protect them from competition.
Take the top holding, ExxonMobil (NYSE:XOM), for example. It would obviously be very difficult and time-consuming for a new company to come in and build up the worldwide energy operation that ExxonMobil has built up for over a century.
To be included in HDV, a dividend stock must have at least a “narrow” moat rating (as opposed to no moat) and rank within the top 50% of stocks in its sector in terms of the Distance to Default metric. This approach helps to weed out weaker and financially unhealthy companies. If a company doesn’t have a moat rating, then it “must have a Morningstar Distance to Default score in the top 30% of eligible dividend-paying companies within their sector,” according to the ETF’s summary prospectus.
Below, you’ll find a list of HDV’s top 10 holdings using TipRank’s ETF holdings screen. They make up 53.1% of HDV’s assets.
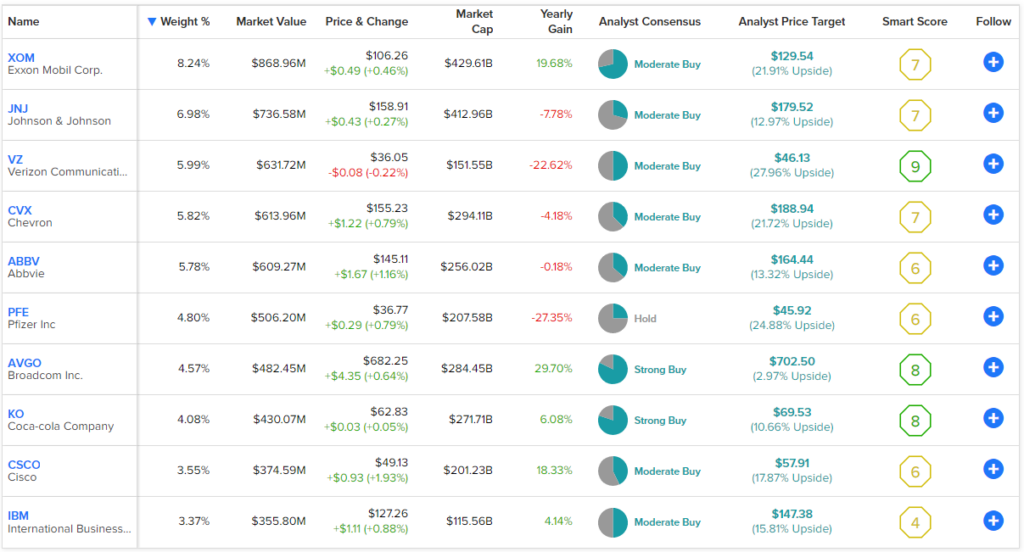
The portfolio skews toward sectors known for their dividends, like energy, healthcare, utilities, and consumer staples. ExxonMobil accounts for 8.2% of assets, and fellow U.S. energy giant Chevron (NYSE:CVX) accounts for 5.8%. The healthcare sector is well-represented through the likes of Johnson & Johnson (NYSE:JNJ), Pfizer (NYSE:PFE), and AbbVie (NYSE:ABBV). You’ll also find some large-cap, legacy tech names like Cisco (NASDAQ:CSCO) and IBM (NYSE:IBM).
It may not be the most exciting list of holdings in the world, but these stocks are rock-solid dividend payers. For example, Coca-Cola (NYSE:KO) and AbbVie are Dividend Kings that have increased their annual dividend payouts for 61 years and 51 consecutive years, respectively.
While many of the Smart Scores for HDV’s top 10 holdings are Neutral, you’ll notice that there are no suboptimal Smart Scores. The Smart Score is a proprietary quantitative stock scoring system created by TipRanks. It gives stocks a score from 1 to 10 based on eight market key factors. A Smart Score of 8 or above is considered an Outperform rating. A Smart Score of 4-7 is equivalent to a Neutral rating, and a Smart Score of 3 or below is equivalent to an Underperform rating.
So, while 8 of the 10 top holdings have Neutral Smart Scores, it does seem like HDV’s strategy has successfully weeded out the underperformers. HDV itself has an ETF Smart Score of 7, which is a Neutral Smart Score, but it’s one that’s at the higher end of Neutral.
Low Valuation
As of the end of the most recent quarter, HDV had an average price-to-earnings ratio of just 12.7. This is a steep discount to the broader market — the S&P 500 currently sports an average P/E multiple of around 24, nearly double the valuation of HDV. Stocks with lower valuations tend to offer investors a better margin of safety when investing, and lower valuations leave more room for future upside.
Low Expense Ratio
HDV features a negligible expense ratio of just 0.08%. This means that an investor putting $10,000 into HDV would only pay $8 in management fees during year one. An investor-friendly expense ratio like this allows investors to protect the value of their portfolios over time. Assuming a 5% return per year and no change to fee, an investor in HDV would pay just $26 over three years, $45 over five years, and $103 over the course of a decade, according to iShares.
As we saw in the ETF comparison above, there are plenty of dividend ETFs that charge much higher expense ratios than HDV, even though HDV outperforms them.
Is HDV Stock a Buy, According to Analysts?
According to the ratings of 729 analysts, HDV stock comes in as a Moderate Buy. 44.31% of ratings are Buys, 45.27% are Holds, and just 10.43% are Sells. The average HDV stock price target of $115.46 implies 16.35% upside potential.

Investor Takeaway
Given its 4% dividend yield, strong track record, solid portfolio of established and financially healthy U.S. dividend stocks, and tiny expense ratio, HDV looks like a good ETF for investors to consider. While other high-yield dividend yields may offer higher yields, HDV has generated more wealth with higher total returns over time, and isn’t that the whole point of investing?
