


There are many ways to invest in emerging markets, but the Cambria Emerging Shareholder Yield ETF (BATS:EYLD) provides investors with a differentiated way to gain exposure to them with a unique strategy (discussed further below). I’m bullish on EYLD based on its effective strategy that has beaten its benchmark over the years, its diversified portfolio, the inexpensive valuation of its holdings, and its attractive 5.4% dividend yield.
Elevate Your Investing Strategy:
- Take advantage of TipRanks Premium at 55% off! Unlock powerful investing tools, advanced data, and expert analyst insights to help you invest with confidence.
What Is the EYLD ETF’s Strategy?
We recently covered the Cambria Shareholder Yield ETF (BATS:SYLD), an attractive ETF that has quietly beaten the market over the past five years. EYLD is similar to SYLD in terms of its investing approach, but it adds an emerging markets angle to the formula.
According to fund sponsor Cambria, EYLD “focuses on companies in emerging market countries that are returning cash to shareholders through three attributes – dividends, buybacks, and net debt reduction.”
Together, these three attributes combine to make up shareholder yield, which is calculated by adding these three factors (dividends, net share repurchases, and net debt reduction) and dividing them by a company’s market capitalization.
By investing in emerging markets companies with a high shareholder yield, EYLD gives investors differentiated exposure to emerging markets compared to its benchmark, the more general MSCI Emerging Markets Index.
First and foremost, the stocks that EYLD owns are decidedly cheaper than the average stock in the emerging markets benchmark. As of December 31, the average price-to-earnings ratio for EYLD’s portfolio was just 8.0 versus an average price-to-earnings ratio of 13.1 for the benchmark. As a reminder, both EYLD and the benchmark are considerably cheaper than U.S.-based stocks, as the S&P 500 (SPX) has an average valuation of 22.1 times earnings.
Lastly, focusing on companies with high shareholder yield may give EYLD exposure to stocks with better growth prospects than simply focusing on stocks with the highest dividend yields, and the focus on dividends and share buybacks may help the ETF soften the blow against market drawdowns.
How Does EYLD Build Its Portfolio?
EYLD is an actively-managed ETF, and its portfolio management team engages in an extensive process to pick the 100 emerging market stocks that make it into its portfolio.
First, the fund’s managers start with a universe of emerging market stocks and then select those with market caps of over $200 million that meet certain liquidity and price thresholds.
They then select the top 20% of these stocks based on their shareholder yields, with attention to their valuations as well. Cambria uses valuation metrics like the price-to-earnings ratio and price-to-book ratio to select stocks it believes are trading below their intrinsic values. Cambria also screens out certain stocks based on quality and leverage metrics.
The portfolio managers then select the top 100 stocks from this group based on their combination of valuation and shareholder yield. The fund is rebalanced quarterly, and the portfolio management team begins the screening process again each quarter.
Benchmark-Beating Performance
This process has led to results that have beaten its benchmark, the plain vanilla MSCI Emerging Markets Index.
As of the end of the most recent quarter, EYLD produced an annualized three-year return of 3.6%, while the benchmark lost 4.7%, giving credence to Cambria’s assertion that focusing on these companies paying dividends and buying back shares can help to mitigate market drawdowns. This return also beat that of the Morningstar Diversified Emerging Markets Category Average, which lost 3.9% on an annualized basis over the same time frame.
EYLD also beat the MSCI benchmark and the Morningstar Diversified Emerging Markets Category Average over a longer five-year time frame, with an annualized return of 8.3% versus annualized returns of 4.1% and 4.4% for the MSCI index and Morningstar category, respectively.
Clearly, EYLD has beaten the returns of emerging markets as a whole, and an 8.3% return over a five-year time frame isn’t bad.
However, it’s important to note that this return has still lagged that of the U.S. stocks. For example, as of the end of last quarter, the Vanguard S&P 500 ETF (NYSEARCA:VOO) has returned 10.0% over the past three years and 15.7% over the past five, so investors would have been better off simply investing in the S&P 500.
That said, it’s not a bad idea for U.S. investors to diversify and gain exposure to cheaper stocks and new potential growth opportunities by investing abroad in emerging markets, and EYLD looks like an effective way to do this with returns that have consistently beaten emerging markets benchmarks.
What Is EYLD’s Expense Ratio?
EYLD charges an expense ratio of 0.66%. This means that an investor will pay $66 in fees on a $10,000 investment annually. While this isn’t cheap, it’s important to remember that this is an actively-managed fund, so it is going to be more expensive than most index funds.
Furthermore, investing in international and emerging markets ETFs is typically more expensive than investing in domestic ETFs. And surprisingly, EYLD is actually a bit cheaper than that of the much larger iShares MSCI Emerging Markets ETF (NYSEARCA:EEM), which simply invests in the aforementioned MSCI Emerging Markets Index benchmark that EYLD has beaten over the years.
EEM charges an expense ratio of 0.70%, meaning that EYLD is the superior choice based on both performance and cost (albeit just a small difference in cost).
EYLD’s Portfolio
With that said, what does EYLD’s portfolio look like? The fund holds 93 stocks, and its top 10 holdings make up just 19.3% of the portfolio, making this a diversified fund with little concentration risk. Below is an overview of EYLD’s top 10 holdings using TipRanks’ holdings tool.
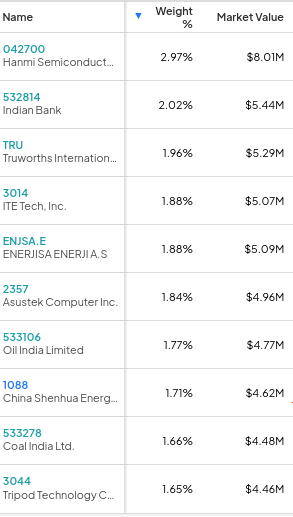
As relatively obscure emerging markets stocks, many of these names will be unfamiliar to most U.S. investors. But as discussed above, they all return cash to shareholders, and they all pass through Cambria’s quality and leverage screens. They also collectively trade at relatively inexpensive valuations, as discussed previously.
The ETF is well-diversified both geographically and across market sectors. As of the end of last quarter, technology is the sector that EYLD is most heavily invested in, with a weighting of 24.1%, followed by energy (17.4%), financials (15.1%), and materials (10.6%).
In terms of countries, 28.6% of the fund is invested in Taiwan, and 17.6% is invested in China. South Africa, South Korea, and India round out the fund’s top five markets with weightings of 15.7%, 12.6%, and 7.6%, respectively.
Yielding North of 5%
Unsurprisingly, for a fund that focuses on dividends and share repurchases, EYLD packs a punch with its dividend and currently yields 5.4%. This yield is well above that of the aforementioned larger emerging market fund, EEM (currently yielding 2.7%), or the average yield for the S&P 500 (1.5%). It is also significantly higher than the yield offered by 10-year treasury bonds in the U.S. (4.2%), making EYLD an attractive income opportunity for investors.
The Takeaway: An Effective Way to Invest in Emerging Markets
EYLD employs a differentiated and successful strategy of investing in emerging market stocks that produce a high shareholder yield. I’m bullish on this ETF as an effective way to gain exposure to emerging markets, as it has soundly beaten its more generalized emerging markets benchmark over the years (not to mention larger competitors like EEM). EYLD is also attractive thanks to the inexpensive valuation of its holdings, its diversified portfolio, and its 5.5% dividend yield.