


Operating as an investment proxy for the cryptocurrency market, Strategy (MSTR) represents a highly “popular” enterprise in the sense that the stock has captured the imagination of both retail and institutional investors. Moreover, because it correlates strongly with the blockchain ecosystem, MSTR stock offers a canvas for an alternative approach to speculating on MSTR stock. Wagers can be further amplified with options strategies, though many people avoid the derivatives market for good reason — it can seem excessively complex.
Meet Your ETF AI Analyst
- Discover how TipRanks' ETF AI Analyst can help you make smarter investment decisions
- Explore ETFs TipRanks' users love and see what insights the ETF AI Analyst reveals about the ones you follow.
Those who have considered trading options are often deterred by the unusual concepts and terminology. For example, the so-called Greeks represent mathematical derivatives designed to approximate how an option will behave as time passes (theta) and the price in the open market changes (delta). Further, the shift in volatility (vega), along with the acceleration of the aforementioned price movements (gamma), can impact the underlying option premium.
In many respects, options symbolize a market within a market. And with so many variables to keep track of — along with a hard deadline since all options expire — it’s no wonder that many retail traders are intimidated by the prospect of dipping their toes into options.
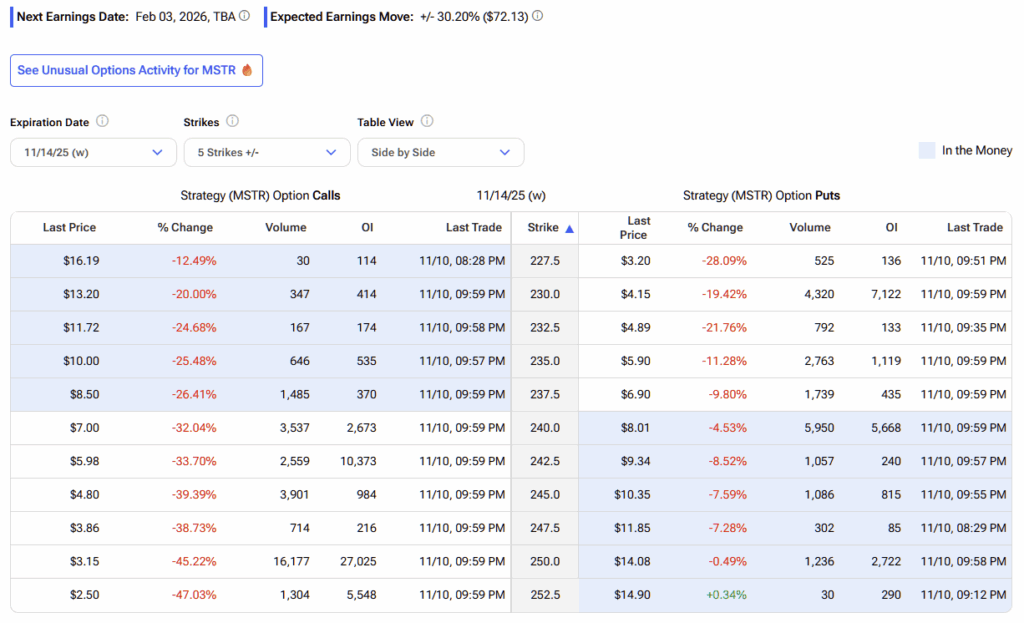
However, if we can identify where and when prices are most likely to cluster, we can effectively sidestep the need for complex Greek analysis — much like using a cheat sheet to ace an exam. With this kind of probabilistic insight, metrics such as gamma and delta serve more as diagnostic indicators than as primary decision-making tools. Additionally, TipRanks’ unusual options activity data can provide a valuable window into major market moves, offering an inside track on significant trades being placed by informed market participants.
In the traditional methodology of options trading, since most traders don’t have a model to determine where a security — especially a kinetic one like MSTR stock — may end up, they use implied volatility (IV) as a secondary proxy for insight. However, the issue here is that IV magnitude only reveals the potential size of price swings, not their direction. So, for all the bravado behind the Greeks, they actually don’t tell you much.
Putting Theory into Practice for MSTR Stock
Building on the early 1900s research of Russian mathematicians Andrey Kolmogorov and Andrey Markov—pioneers in stochastic processes and probability theory—there exists an alternative way to think about options trading. Their work suggests that different market stimuli produce distinct behavioral patterns, and these behaviors can be quantified probabilistically, almost like separate “population groups.” When the actual probability distribution of these behaviors deviates favorably from what would be expected under normal market conditions, that gap can signal an informational arbitrage opportunity—a potential edge that savvy traders may be able to exploit.
Using this approach, we begin by noting that the forward 10-week median returns of MSTR stock (using data dating back to January 2019) can be represented as a probabilistic curve, with outcomes ranging between $240 and $252 (using Friday’s close of $241.93 as an anchor). Further, price clustering can be expected predominantly near $245.80.
However, these calculations are based on the aggregate of all market behaviors within the previously defined dataset. The argument at hand is that MSTR stock is not in a homeostatic or baseline state.
Quantitatively, MSTR stock is structured in a 4-6-D formation, meaning that over the past 10 weeks, the security printed four up weeks and six down weeks, with an overall downward slope. Under these conditions, forward 10-week returns can be expected to range between $230 and $290. In other words, while the risk tail of the distribution has stretched slightly in the wrong direction, the reward tail has expanded even further, offering a significantly greater upside potential.
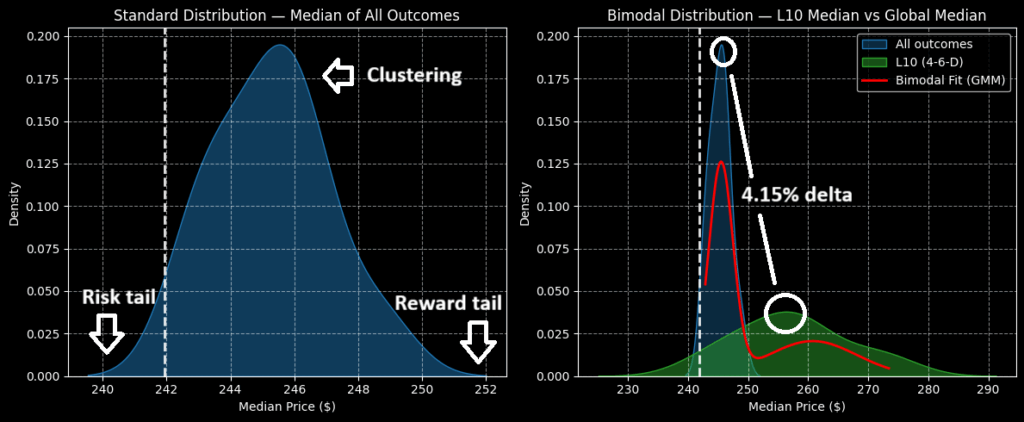
In colloquial terms, a historical tendency exists for investors to buy the MSTR stock on dips. Most enticingly, price clustering following the 4-6-D signal flashing tends to occur around $256. That’s a 4.15% positive delta in density dynamics that no other retail methodology — whether technical or fundamental — is picking up.
Essentially, one can utilize the work done by Russian mathematicians, including their axioms, to uncover favorable asymmetries and close the informational arbitrage. The elegance of this quantitative approach lies in having the distributional curves of price expectations for the next 10 weeks. Therefore, you can make an informed decision about what trade best suits your personal risk-reward tolerance.
Having said that, perhaps the most aggressive trade that’s within a contextually realistic purview is the 250/265 bull call spread expiring December 19. This transaction involves buying the $250 call and simultaneously selling the $265 call, for a net debit paid of $675 (the maximum possible loss on the trade).
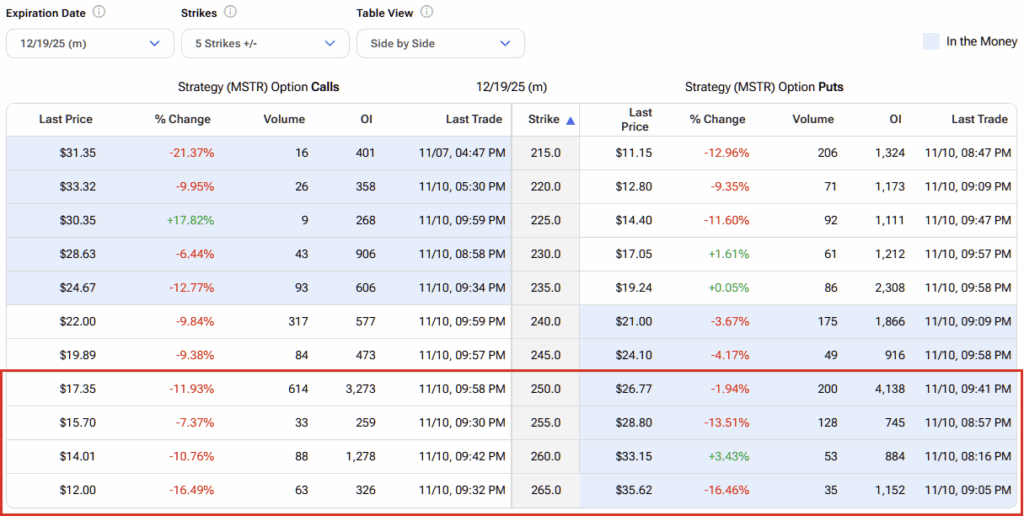
If MSTR stock rises through the second-leg strike of $265 at expiration, the maximum profit is $825, a payout of over 122%. Further, the breakeven price is $256.75, which is reachable considering the expected density dynamics.
What is the Price Target for MSTR in 2025?
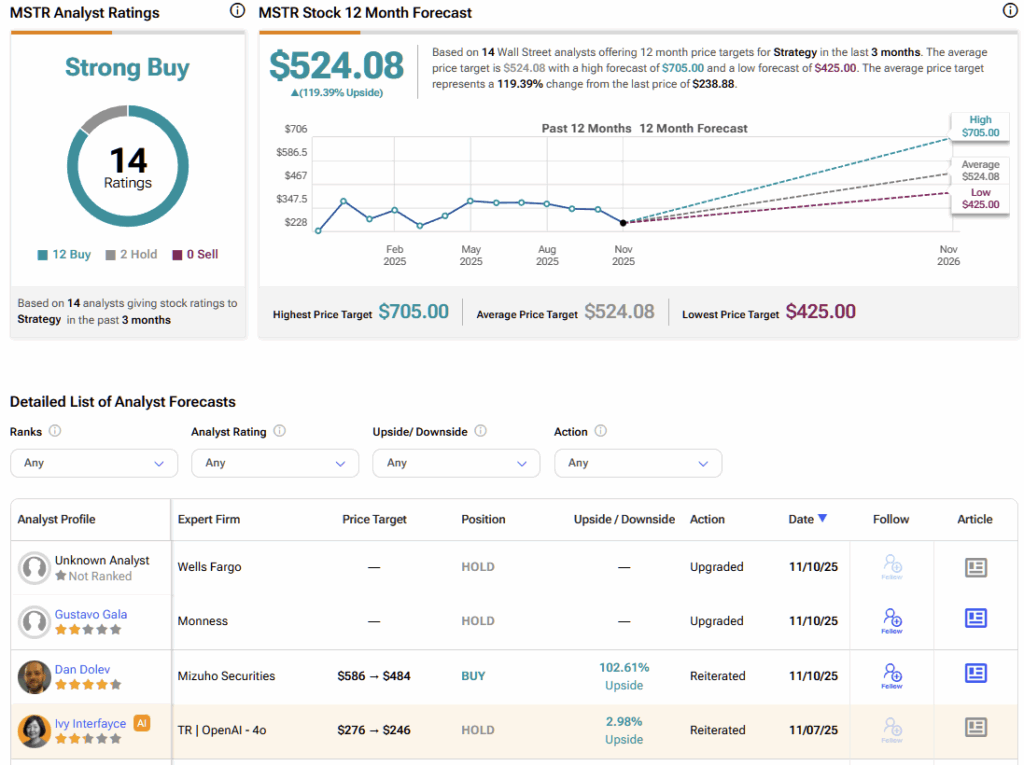
Turning to Wall Street, Strategy (MSTR) carries a Strong Buy consensus rating, supported by 12 Buy ratings, 2 Holds, and no Sells over the past three months. MSTR’s average stock price target of $524.08 suggests an eye-watering 119% upside potential over the next twelve months.
Simplifying Options Trading Through Probability
While options trading is often taught as a highly complex discipline, it doesn’t have to be so daunting. Drawing on the early 20th-century research of Russian mathematicians Andrey Kolmogorov and Andrey Markov—whose work in stochastic processes and probability theory laid the foundation for modern quantitative analysis—we can approach markets through a different lens.
Instead of relying solely on the Greeks as decision-making tools, traders can model price action as a range of probabilistic, clustered outcomes. This framework transforms the process from abstract math into practical probability mapping, allowing traders to identify where prices are most likely to converge and focus on opportunities that offer the most favorable risk–reward balance. In essence, this method transforms the market into a system of measurable tendencies, making the pursuit of profitable trades both more transparent and more efficient.