

When it comes to the USD-JPY, it’s a tug-of-war between conflicting technical signals. On one hand, we have strong moving averages suggesting a Buy. On the other, the MACD indicator is waving a big red flag. Let’s dive into the mess and figure out whether to stick with the bullish trend or prepare for a bearish slide.
Long-Term Outlook: Betting on the Bull
Bullish Case: The long-term view has plenty of reasons to be bullish. The 20-period and 50-period EMAs are screaming buy across all timeframes:
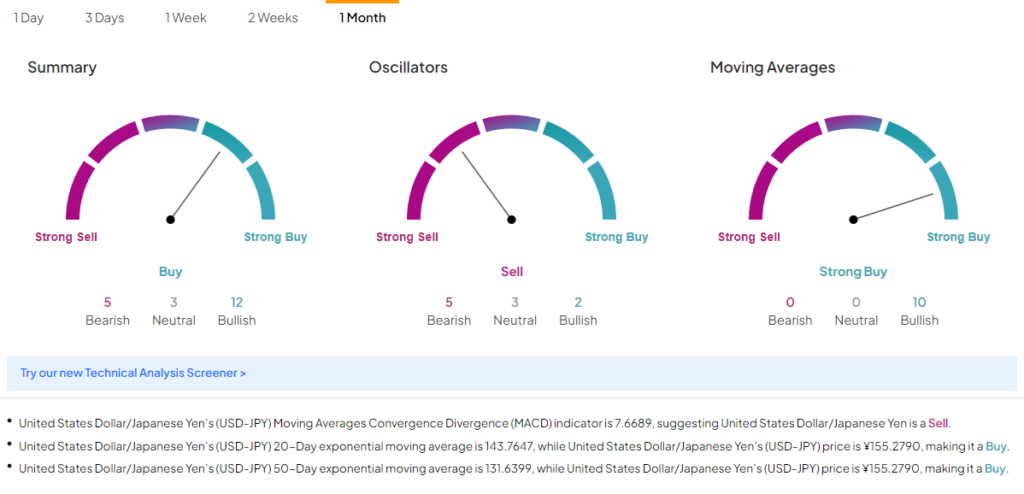
- 1 Month Timeframe:
- 20-Period EMA: 143.76 (Buy)
- 50-Period EMA: 131.63 (Buy)
- Current Price: 155.31
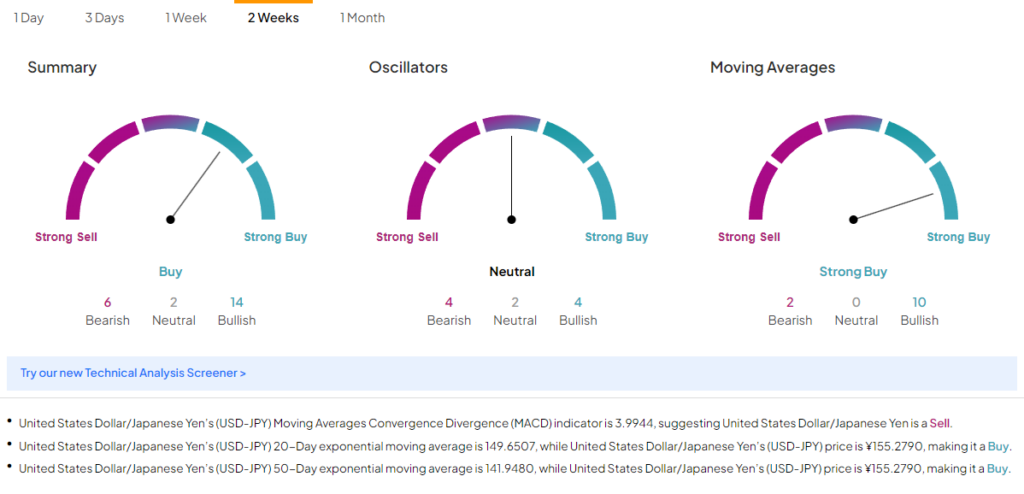
- 2 Week Timeframe:
- 20-Period EMA: 149.65 (Buy)
- 50-Period EMA: 141.94 (Buy)
- Current Price: 155.31
Price is way above these levels, suggesting strong upward momentum. If U.S. economic data keeps delivering, the dollar might just keep climbing.
Bearish Case: But hold on, the MACD is telling a different story:
- 1 Month Timeframe MACD: 7.66 (Sell)
- 2 Week Timeframe MACD: 3.99 (Sell)
The MACD suggests the current price might be overextended and due for a correction. If Japan’s economy shows any signs of life or the U.S. economy stumbles, USD-JPY could take a nosedive.
Short-Term Outlook: A Rocky Road Ahead?
Bullish Case: Short-term, the USD-JPY pair still looks strong if you’re following the EMAs:
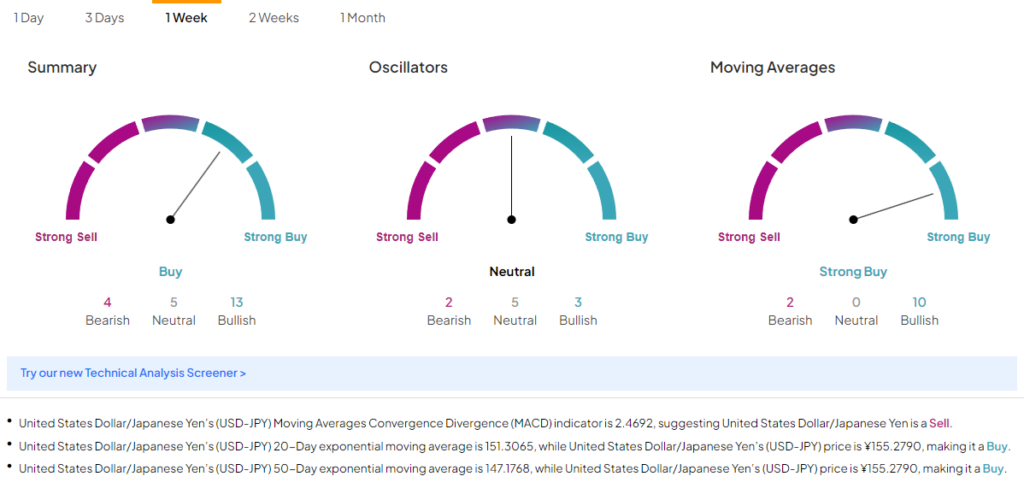
- 1 Week Timeframe:
- 20-Period EMA: 151.30 (Buy)
- 50-Period EMA: 147.17 (Buy)
- Current Price: 155.31
- 3 Day Timeframe:
- 20-Period EMA: 153.13 (Buy)
- 50-Period EMA: 150.00 (Buy)
- Current Price: 155.31
These indicators suggest a solid buy signal. Price staying above these EMAs means the pair could see more short-term gains.
Bearish Case: But again, the MACD is the party pooper:
- 1 Week Timeframe MACD: 2.46 (Sell)
- 3 Day Timeframe MACD: 2.01 (Sell)
Short-term traders might want to heed the MACD’s warnings. Despite the bullish EMA signals, there’s an underlying weakness suggesting a possible pullback. Any bad news could trigger a swift downturn.

Long-Term Investors Might Feel Safer Following the Bullish Trend
So, where does this leave us? The bullish signals from the EMAs suggest holding or buying more, especially if you believe in the ongoing strength of the U.S. economy and the weakness of the yen. But the MACD’s sell signals warn of potential corrections. Long-term investors might feel safer betting on the bullish trend, while short-term traders should watch out for those MACD signals and prepare for possible pullbacks.
