
March same-store sales jumped 7.2% year-over-year, the highest rate of increase since June 2023
Inflationary pressures remained subdued – average prices increased 0.7% year-over-year
NEWARK, N.J., April 08, 2024 (GLOBE NEWSWIRE) — NRSInsights, a provider of sales data and analytics drawn from retail transactions processed through the National Retail Solutions (NRS) point-of-sale (POS) platform, today announced comparative same-store sales results for March 2024.
As of March 31, 2024, the NRS retail network comprised approximately 29,800 active terminals scanning purchases at independent retailers including bodegas, convenience stores, liquor stores, grocers, tobacco, and sundries sellers nationwide, predominantly serving urban consumers.
March Retail Same-Store Sales Highlights
(Same-store sales, unit sales, transactions, and average price data throughout this release refer to March 2024 unless otherwise noted. All comparisons are provided on a “per calendar day” basis to remove from consideration variability in the number of days per month.)
- Same-store sales increased 7.2% from a year earlier (March 2023). In February 2024, average sales had increased 3.5% compared to February 2023.
- Same-store sales per calendar day increased 6.6% compared to February 2024. Same-store sales per calendar day in February 2024 had increased 7.4% compared to January 2024.
- For the three months ended March 31, 2024, same-store sales per calendar day increased 3.3% compared to the three months ended March 31, 2023.
- The number of items sold increased 7.8% compared to March 2023. In February 2024, the number of items sold increased 4.4% per calendar day compared to February 2023.
- The average number of transactions per store increased 4.6% compared to March 2023. In February 2024, the average number of transactions per calendar day had increased 2.0% compared to February 2023.
- A dollar-weighted average of prices for the top 500 items purchased increased 0.7% year-over-year, a decrease from the 1.2% year-over-year increase recorded in February 2024.
Commentary from Suzy Silliman (SVP, Data Strategy and Sales at NRS)
“The NRS Network’s same-store sales were again strong in March, providing further evidence of continued resilience in consumer spending. Dollars, units, and traffic all tallied solid increases versus the year ago, while prices for our most popular items over the same period increased less than one percent. Standouts included increased sales of beverage categories across most alcoholic and non-alcoholic sub-categories with the notable exception of Energy Drinks, which were flat for the second consecutive month, breaking an extended growth trend.”
“Turning to select seasonal trends…while same store sales for the Candy category rebounded in February with sequential and year-over-year gains, the momentum was not sustained in March. Candy unit sales decreased ~7% and dollars declined ~2% compared to March 2023. This is notable because Easter, which typically provides Candy with a strong seasonal lift, was in March this year, as opposed to in April in 2023. More granularly, within the Candy category, the increased price of chocolate and the barrage of media coverage on the spiking prices of cocoa and sugar likely contributed to the significant decreases in Chocolate and Confectionary sales this year. Many cooking and baking categories, on the other hand, enjoyed strong March sales versus the year ago, likely reflecting Easter timing.”
Retail Trade Comparative Data
The table below provides historical comparative data with the U.S. Commerce Department’s Advance Monthly Retail Trade same-store sales data excluding food service:
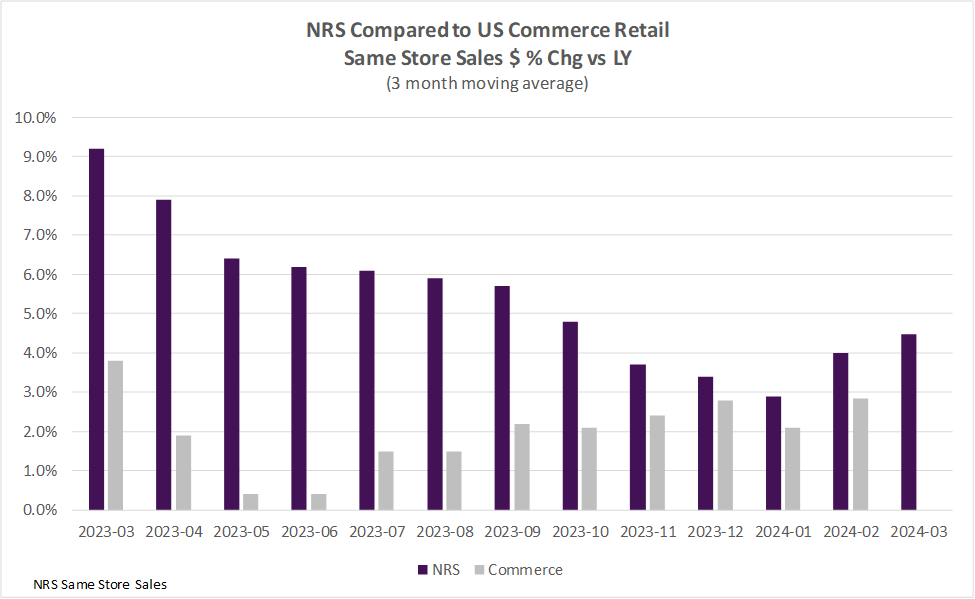
Over the past twelve months, the NRS network’s three-month moving average same-store sales have outpaced the US Commerce Department’s Advance Monthly Retail Trade data excluding food services by 4.5% percentage points, on average.
The NRSInsights data have not been adjusted to reflect inflation, demographic distributions, seasonal buying patterns, item substitution, or other factors that may facilitate comparisons to other periods, to other same-store retail sales data, or to the U.S. Commerce Department’s retail data.
NRSInsights Reports
The NRSInsights monthly Same-Store Retail Sales Reports are intended to provide timely topline data reflective of sales at NRS’ network of independent, predominantly urban, retail stores.
Same-store data comparisons of March 2024 with March 2023 are derived from approximately 172 million transactions processed through the 17,336 stores on the NRS network that scanned transactions in both months. Same-store data comparisons of March 2024 with February 2024 are derived from approximately 216 million transactions processed through 24,745 stores.
Same-store data comparisons for the three months ended March 31, 2024 with the year-ago three months are derived from approximately 460 million scanned transactions processed through the stores that were in the NRS network in both quarters.
NRS POS Network
The NRS network comprises approximately 29,800 active POS terminals operating in approximately 25,900 independent retail stores. Its platform predominantly serves small-format, independent, retail stores including convenience stores, bodegas, liquor stores, grocers, tobacco and sundries sellers. The network includes retailers in all 50 states and in 197 of the 210 designated market areas (DMAs) in the United States. NRS’ POS terminals have processed $18.2 billion in sales through approximately 1.3 billion transactions during the twelve months ended March 31, 2024.
About National Retail Solutions (NRS):
National Retail Solutions operates the largest point-of-sale (POS) terminal-based platform and digital payment processing service for independent retailers nationwide. Retailers utilize NRS offerings to process transactions and effectively manage their businesses. Consumer packaged goods (CPG) suppliers, brokers, analytics firms, and advertisers access the terminal’s digital display network to reach these retailers’ predominantly urban, multi-cultural shopper base, and to harness transaction data-based learnings to identify growth opportunities and measure execution and returns on marketing investment. NRS is a subsidiary of IDT Corporation (NYSE: IDT).
All statements above that are not purely about historical facts, including, but not limited to, those in which we use the words “believe,” “anticipate,” “expect,” “plan,” “intend,” “estimate,” “target” and similar expressions, are forward-looking statements within the meaning of the Private Securities Litigation Reform Act of 1995. While these forward-looking statements represent our current judgment of what may happen in the future, actual results may differ materially from the results expressed or implied by these statements due to numerous important factors. Our filings with the SEC provide detailed information on such statements and risks, and should be consulted along with this release. To the extent permitted under applicable law, IDT assumes no obligation to update any forward-looking statements.
NRSInsights Contact:
Suzy Silliman
SVP, Data Strategy and Sales at NRS
National Retail Solutions
suzy.silliman@nrsplus.com
IDT Corporation Contact:
Bill Ulrey
william.ulrey@idt.net
# # #
Attachment

